
Today we will make a multifunctional weather station for observing the indoor microclimate.
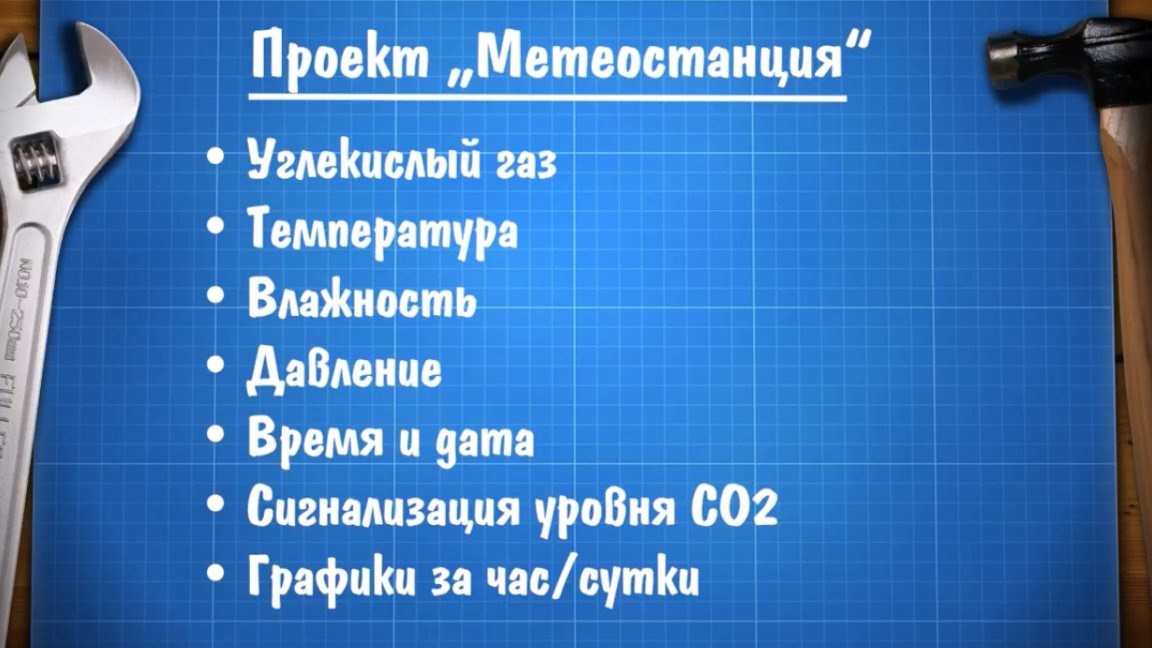
The author of the AlexGyver YouTube channel has long wanted to do something like this so that she (the station) measures various microclimate parameters in the room, in particular carbon dioxide concentration. Also, our station should show other microclimate parameters, for example, temperature, humidity, pressure, show the time and date, signal, for example, the level of carbon dioxide, well, and to heap up graphs at different time intervals, it will be useful, as for the sake of interest , and it will be useful to fans of something to grow or contain specific animals.
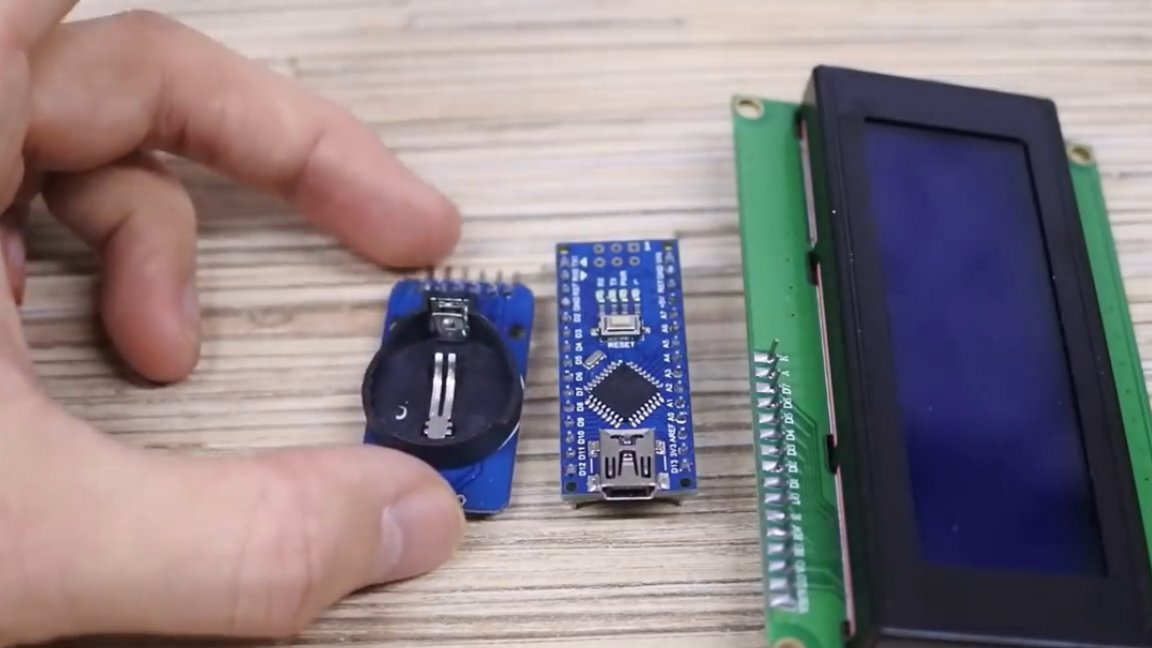
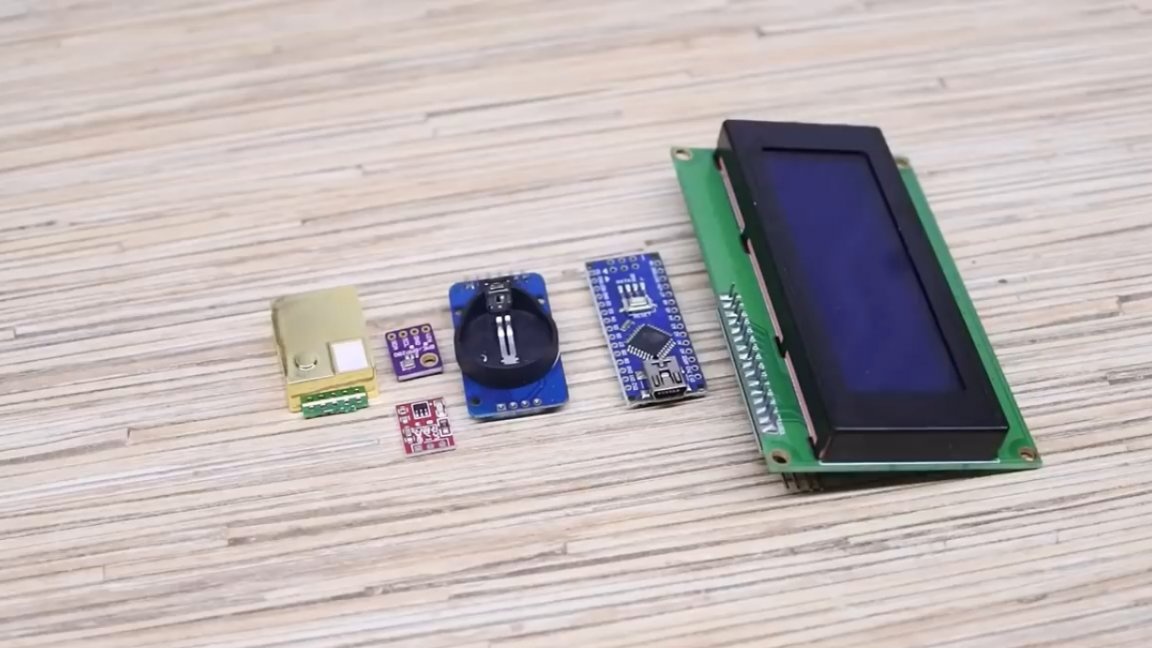
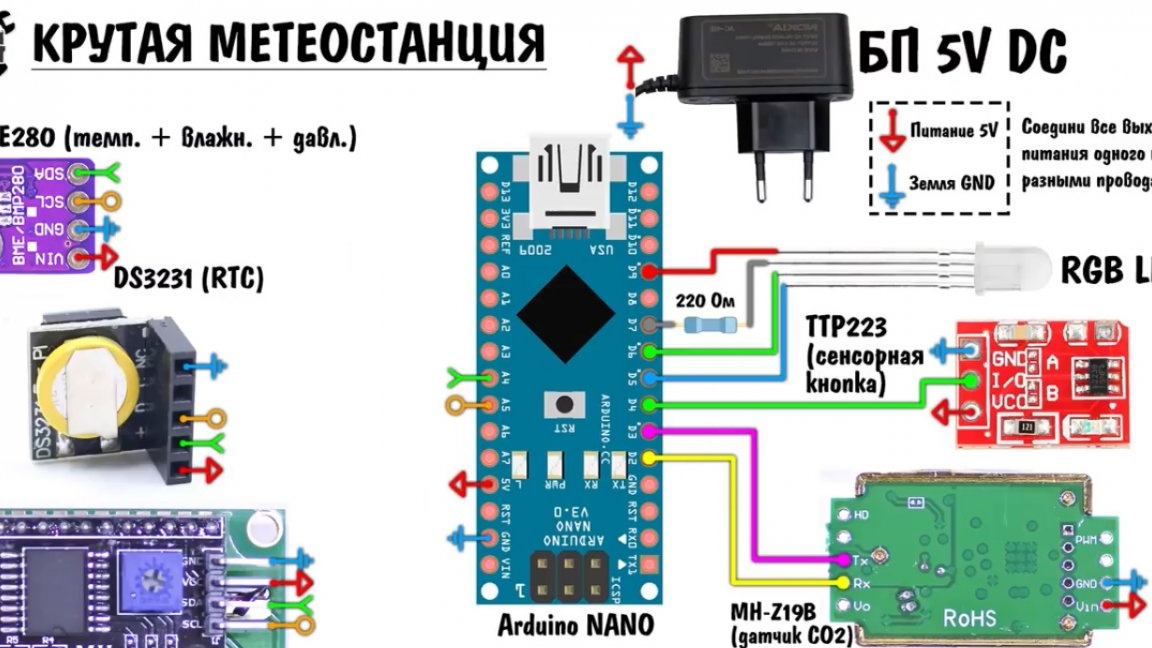
The system is based on a platform arduino nano, which will read sensors and display them. The display will take the cheapest of the large, symbolic 2004 with an adapter to the I2C bus. There is a lot of space on the display, so we will organize the clock. To do this, you need a real-time module that will count seconds, even after turning off the power.
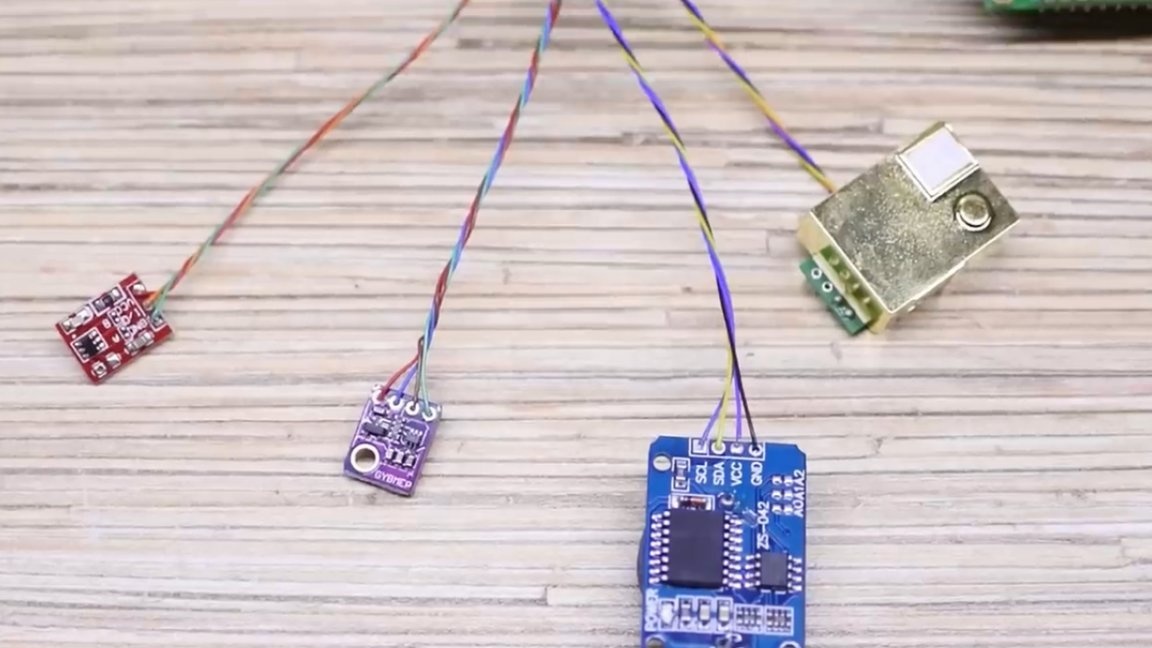
The main sensor of our weather station BME280, appeared among the Chinese relatively recently.
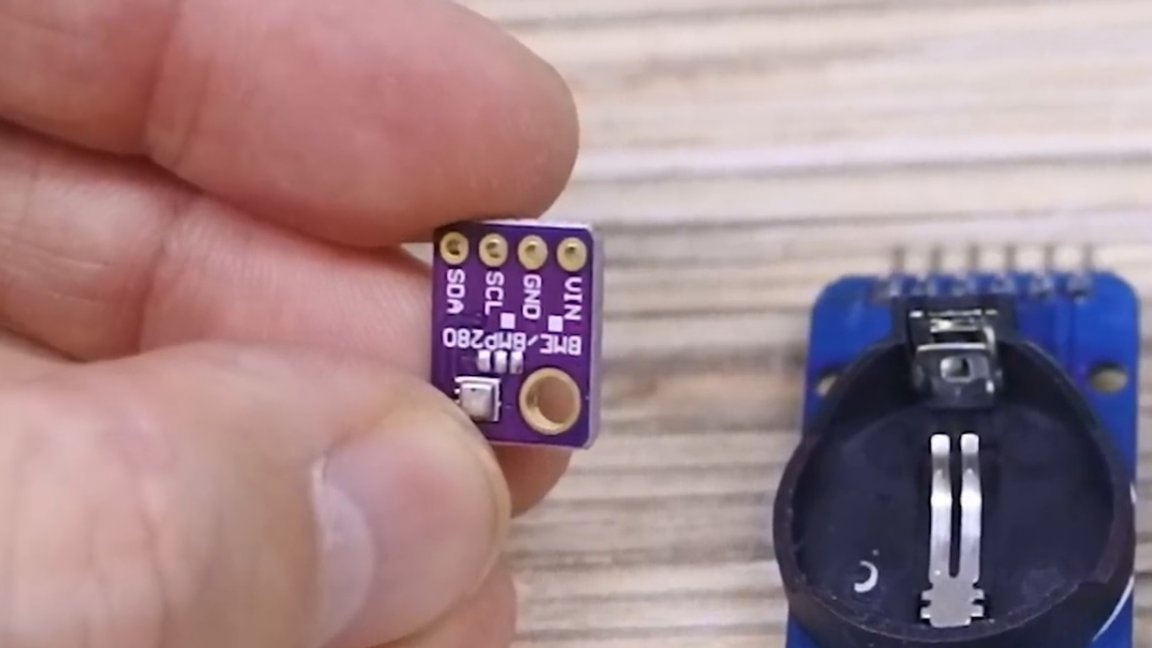
This sensor is cool in that it costs a little more than a shawarma stick, but it can measure temperature, humidity and atmospheric pressure with high accuracy. And all this in this little box with a hole.
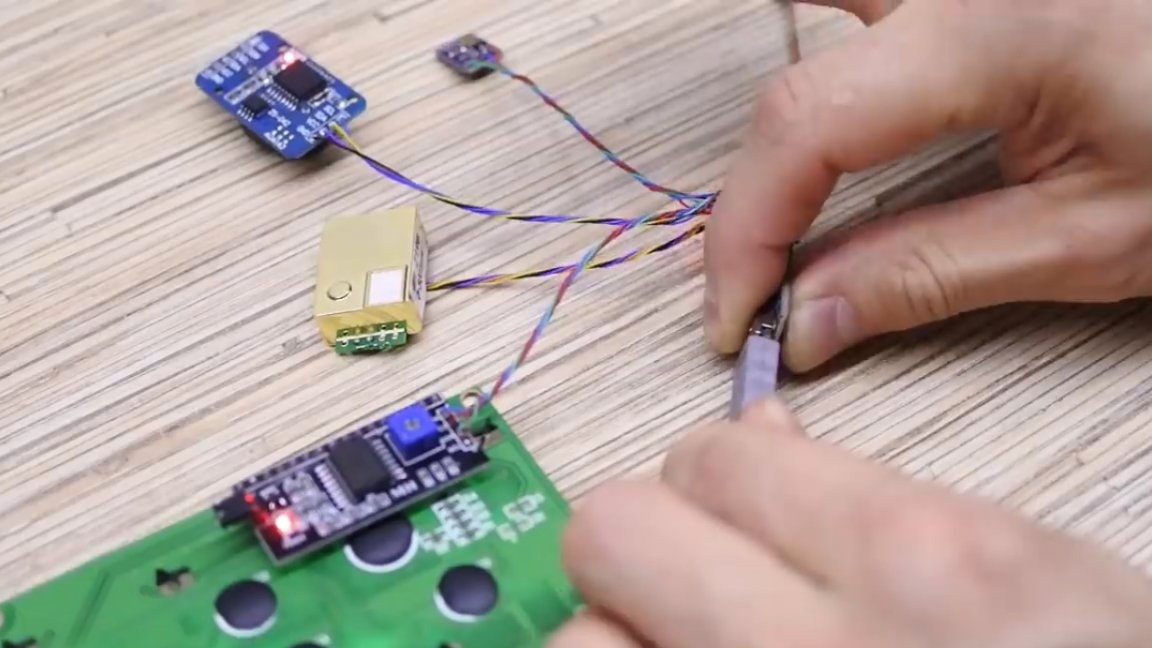
The next sensor is the MH-Z19, actually a carbon dioxide sensor, it is the most expensive in this scheme, costs 1000 with a tail of rubles. To switch modes, we will use the touch button, which will be located inside the case and will respond to the finger through its wall. Also, to display carbon dioxide, you need a 3-color LED.
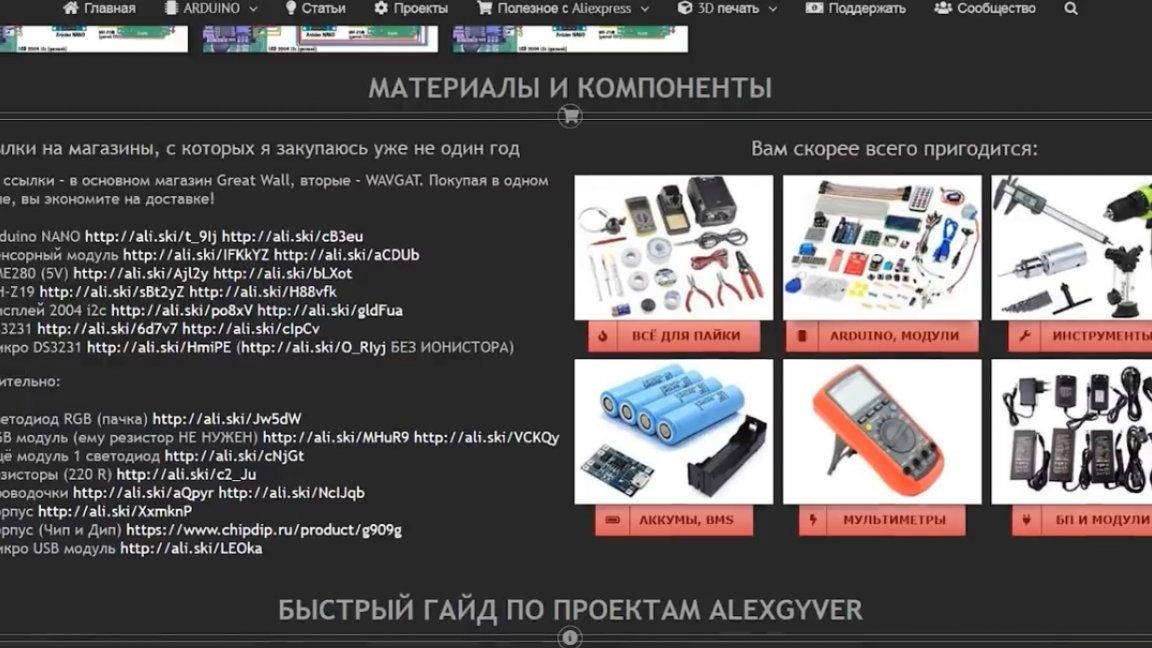
All components are bought on aliexpress, you will find links to.
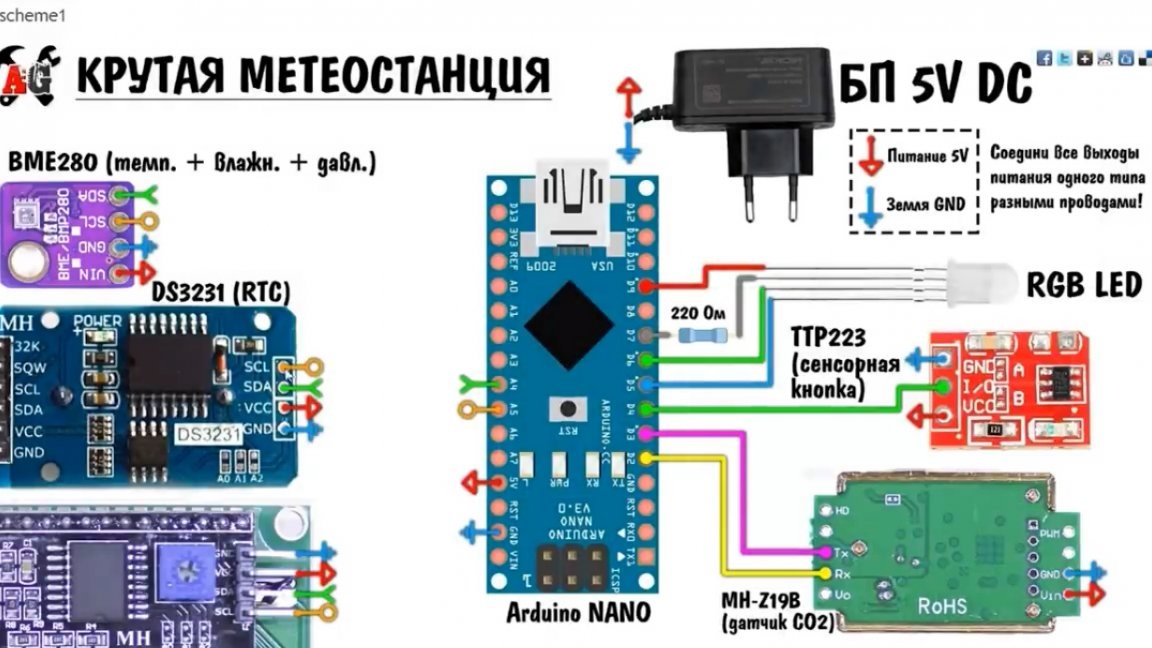
Now we need to solder everything according to the scheme. On the project page there are 2 options for the scheme, but they are completely identical, just the author designed them differently.
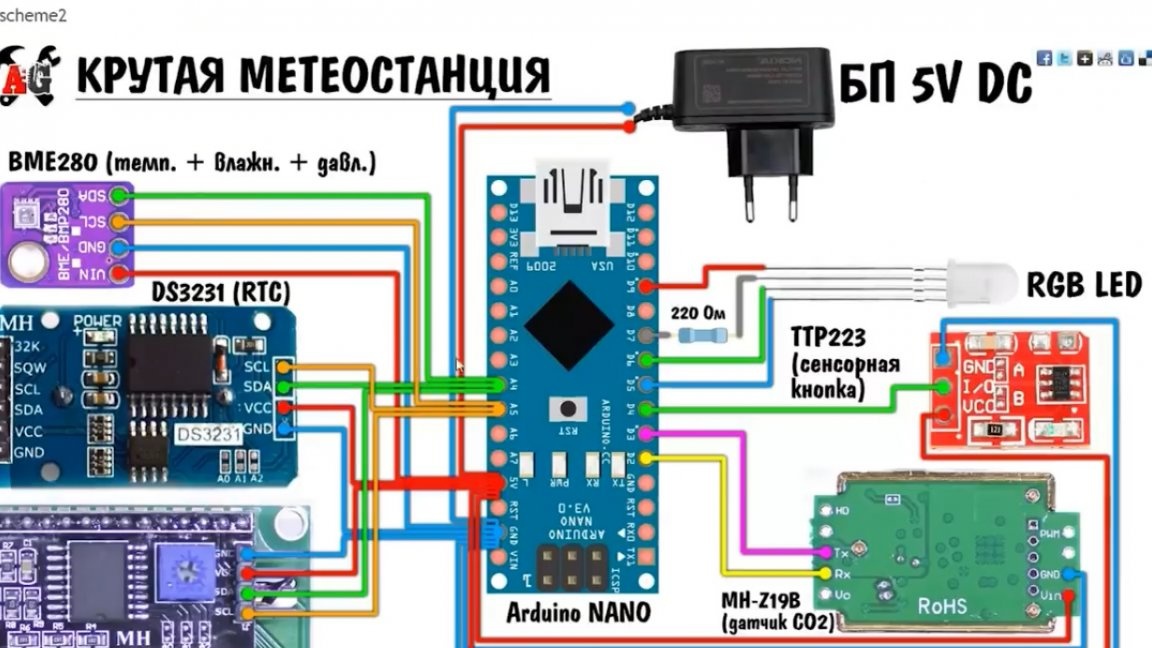
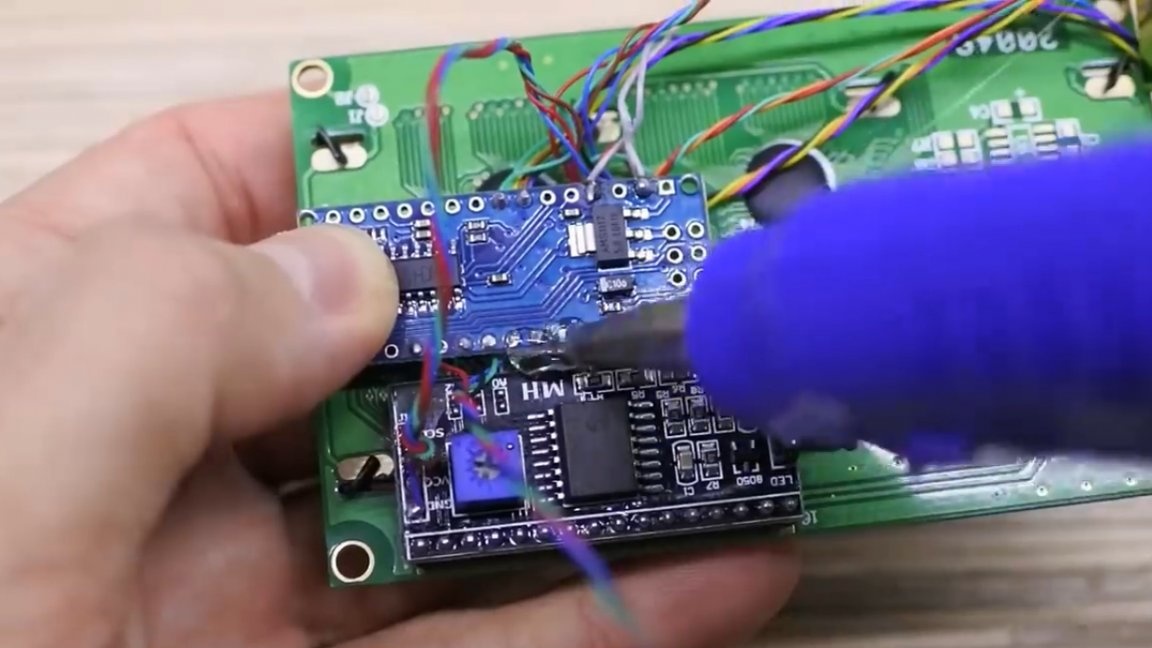
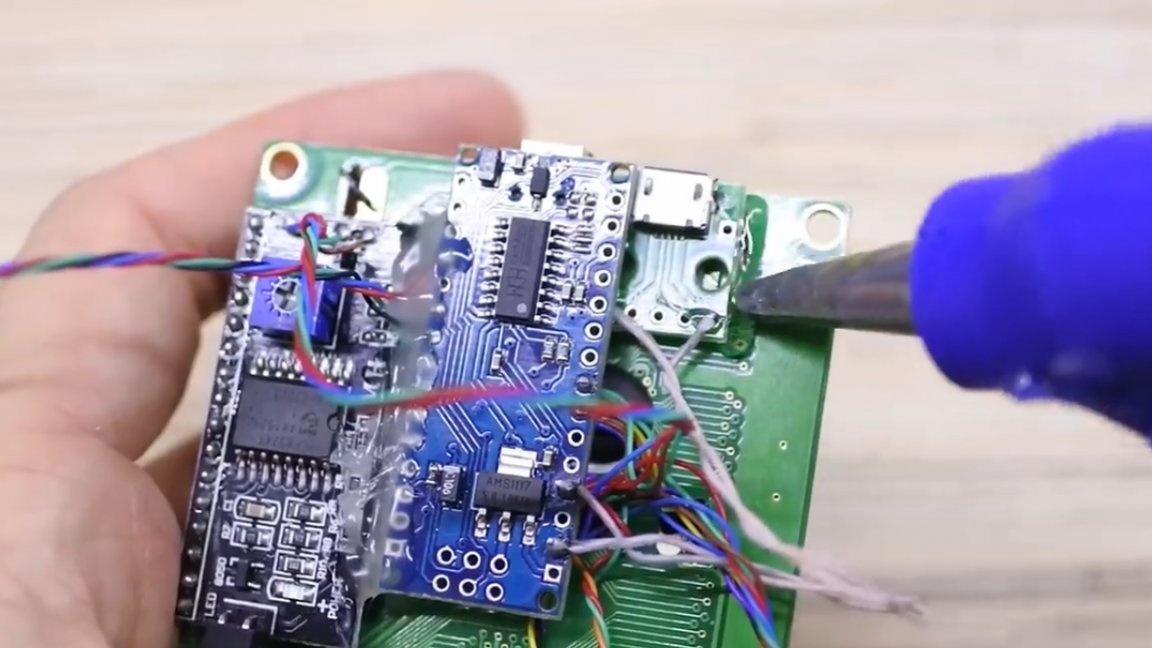
Well, actually here, everyone soldered.
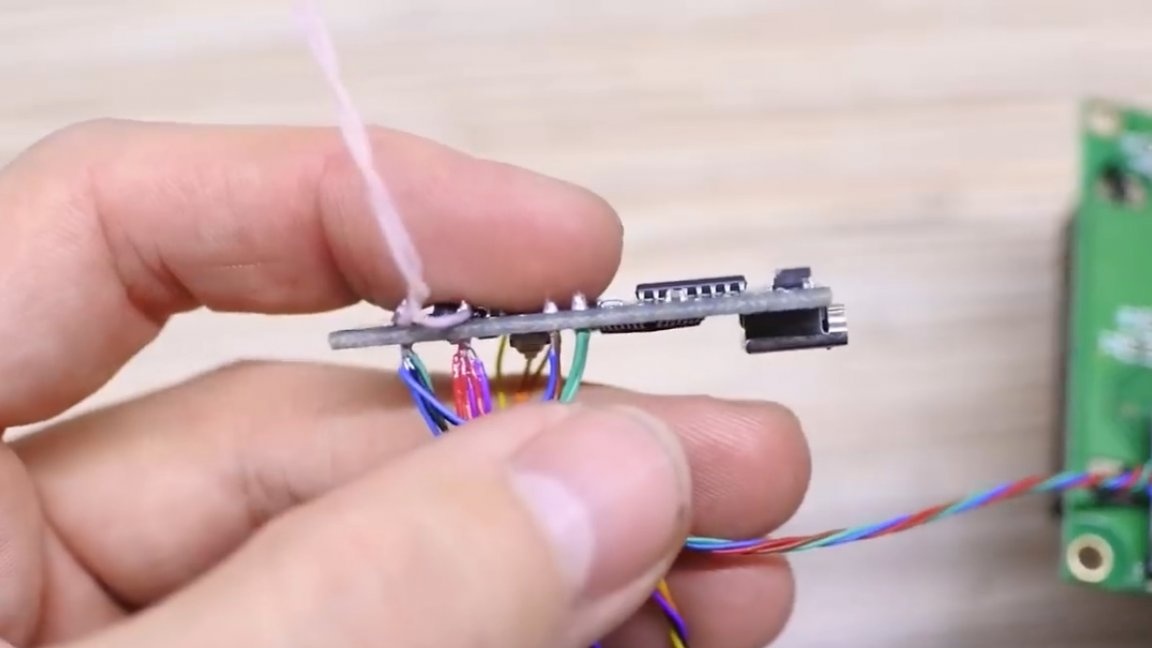
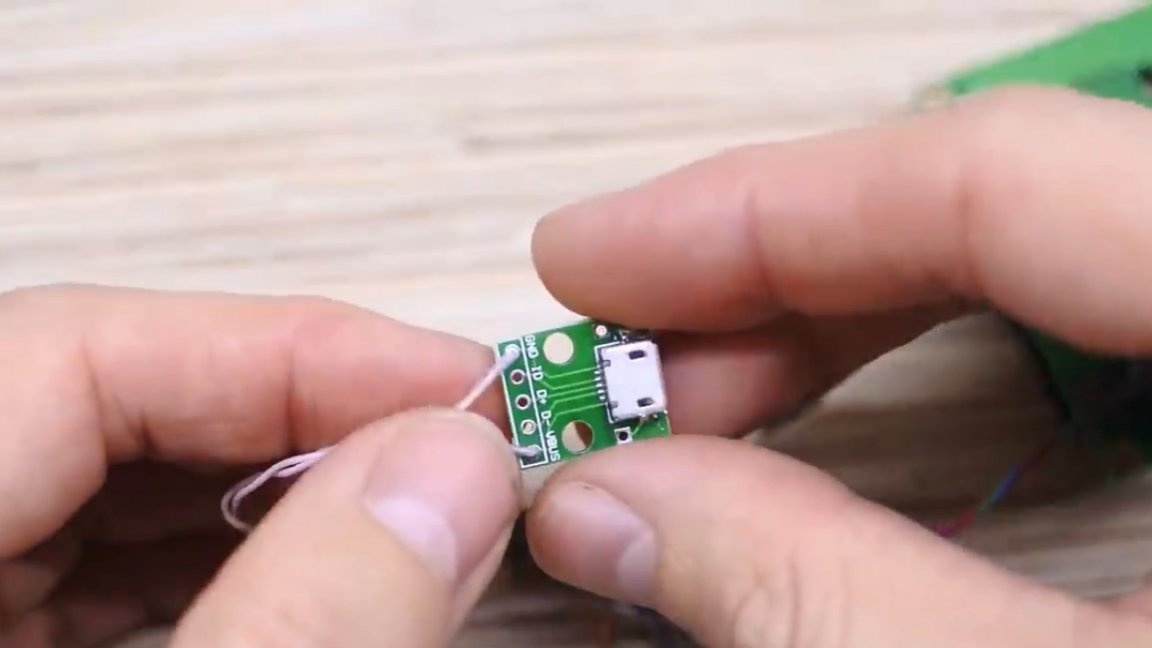
As in the diagram, we twist the common wires into a bundle and solder on an arduino. The author soldered to the power wires separately and at the end used a micro USB module, for more convenient use.
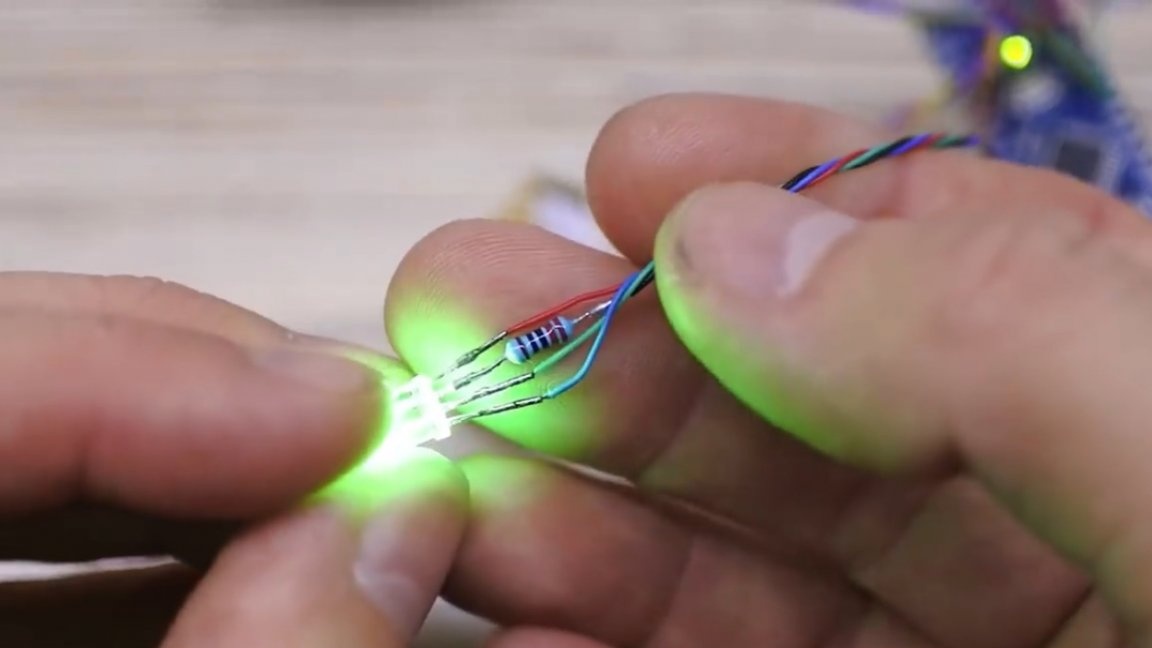
And here is another LED with a resistor on the common leg.
Now we connect arduino to the computer to download the firmware. Download the firmware archive again. There is nothing complicated, everything is done with a few clicks of the mouse.
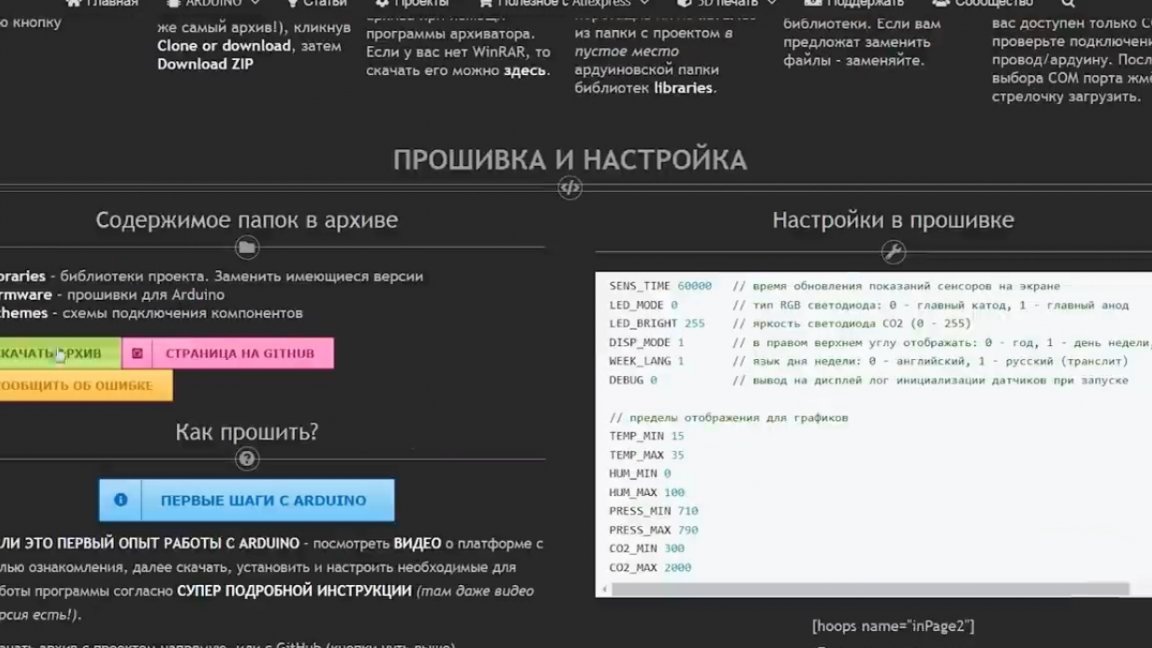
There are several settings in the firmware itself.
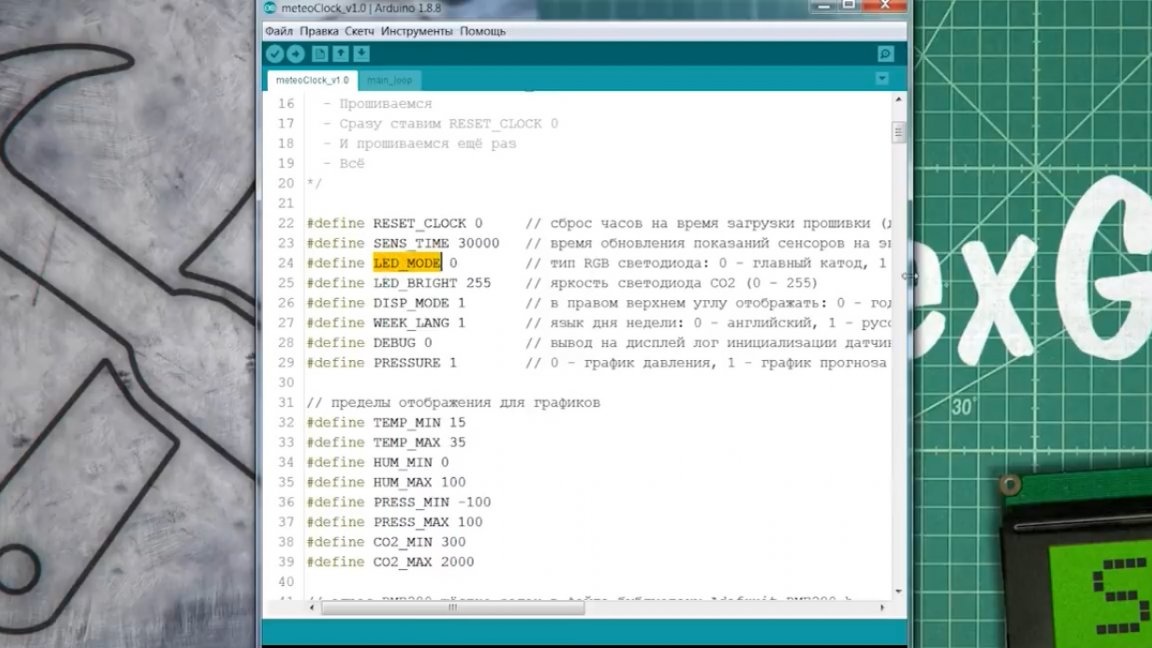
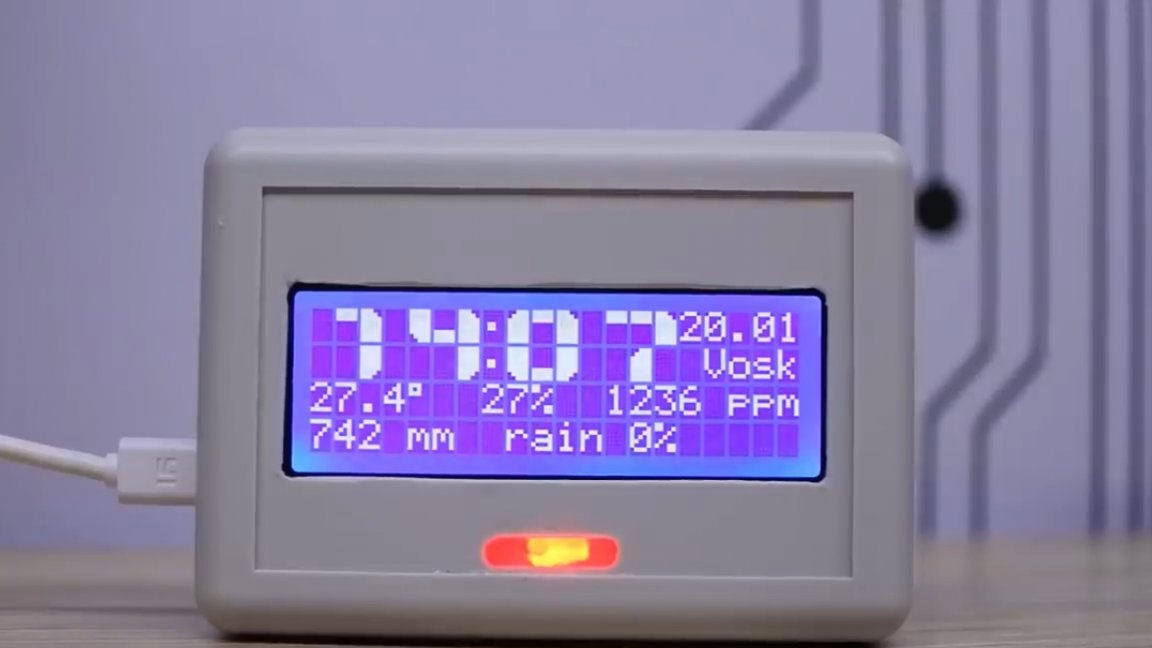
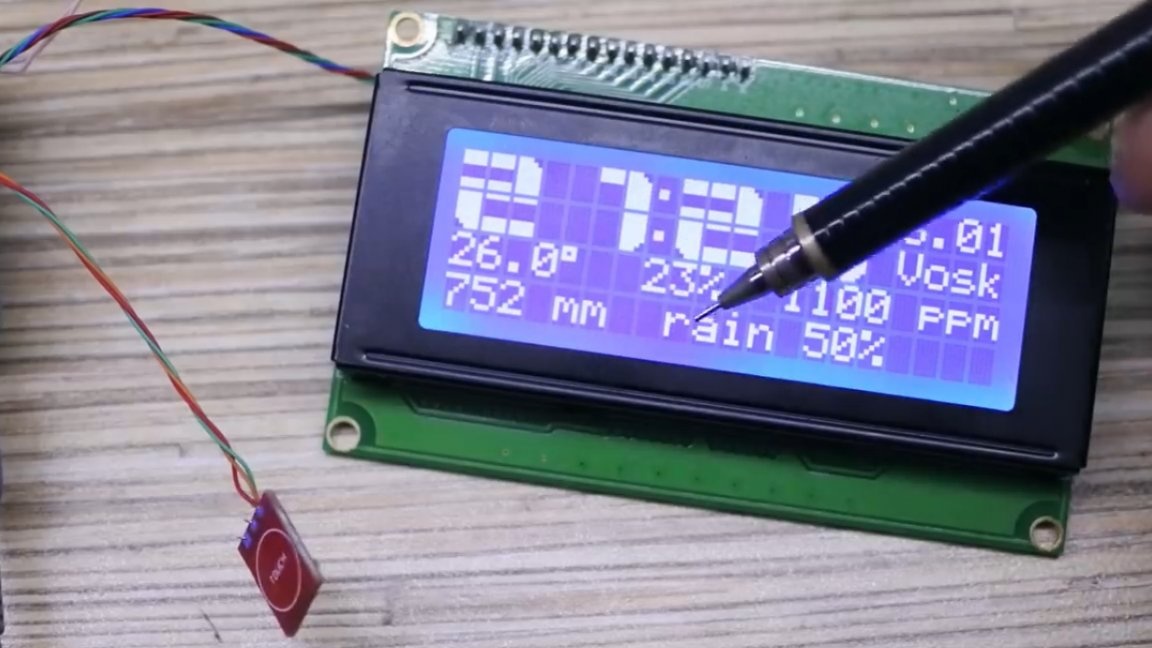
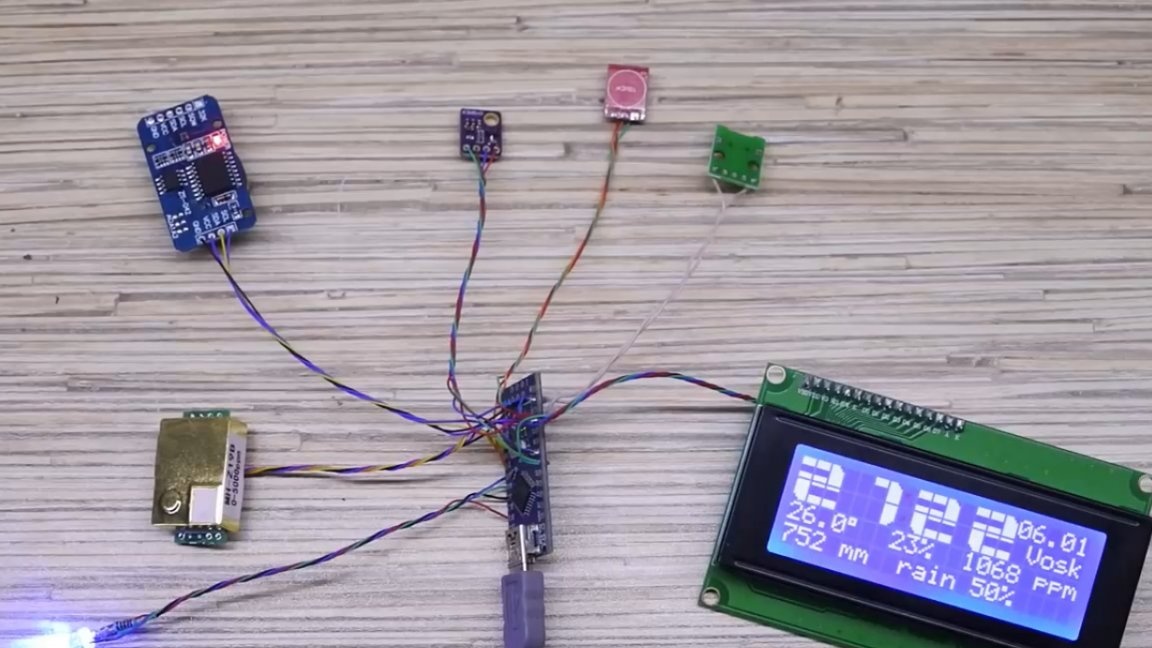
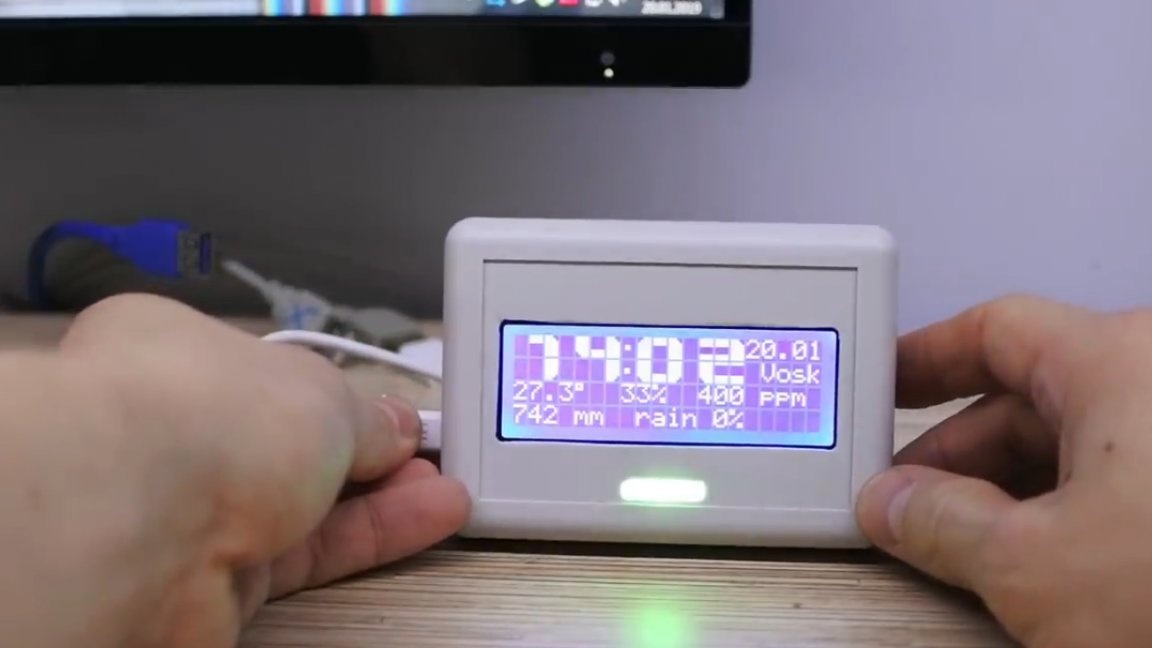
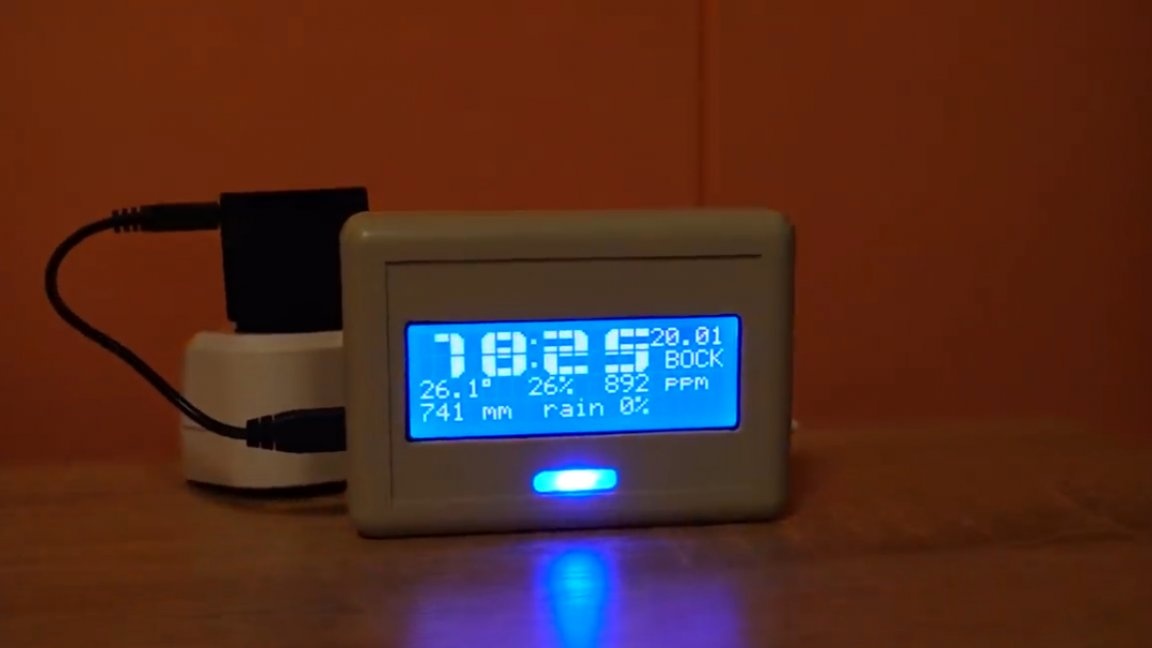
That means that we have here.Big clock:
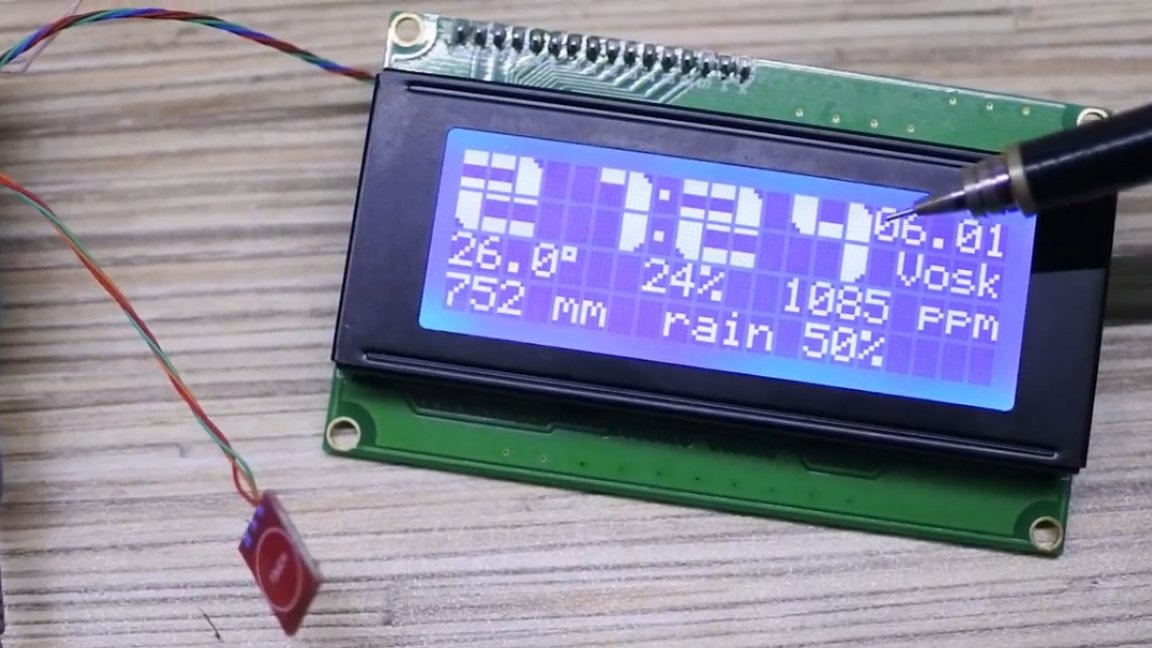
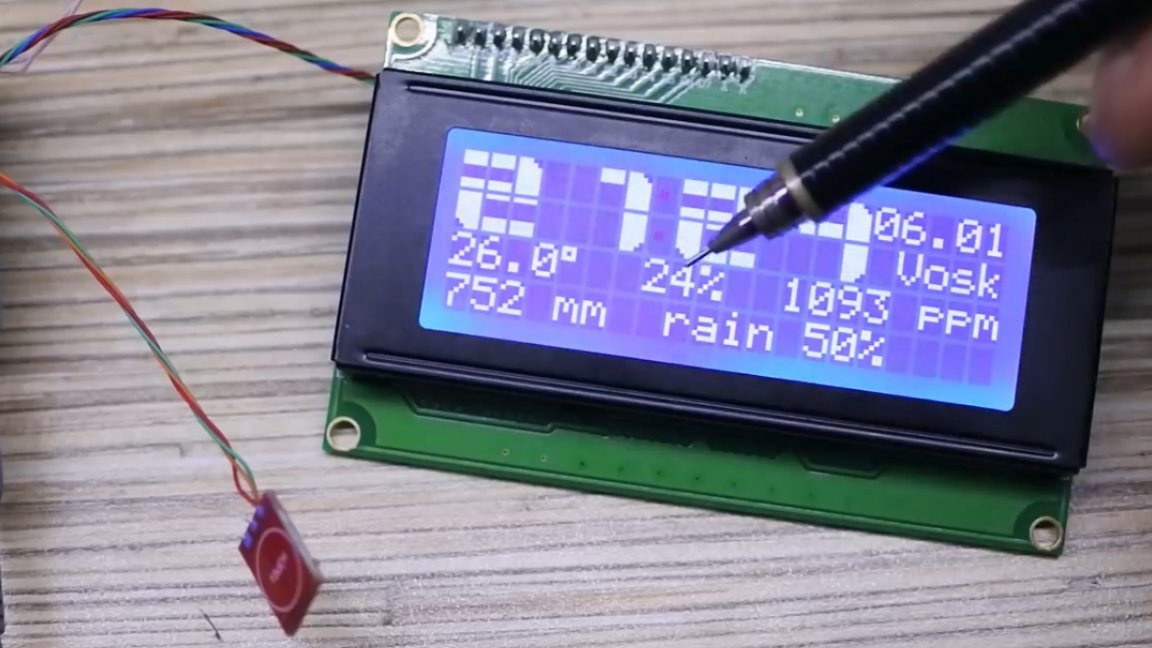
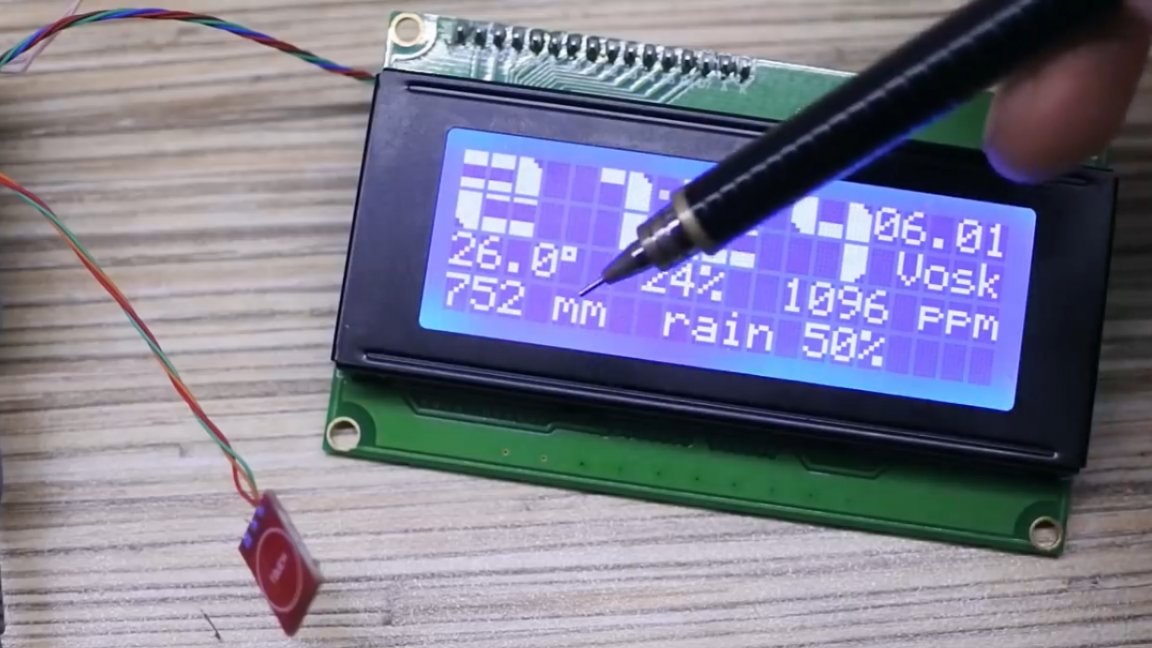
Time and date, by the way, are set automatically during firmware download. They are installed the same as on the computer from which the firmware is downloaded. To the right of the clock is a date. Below we have a line of our choice (now stands the day of the week with transliteration "Vosk" - Sunday). In the firmware, you can put the year or seconds in real time.
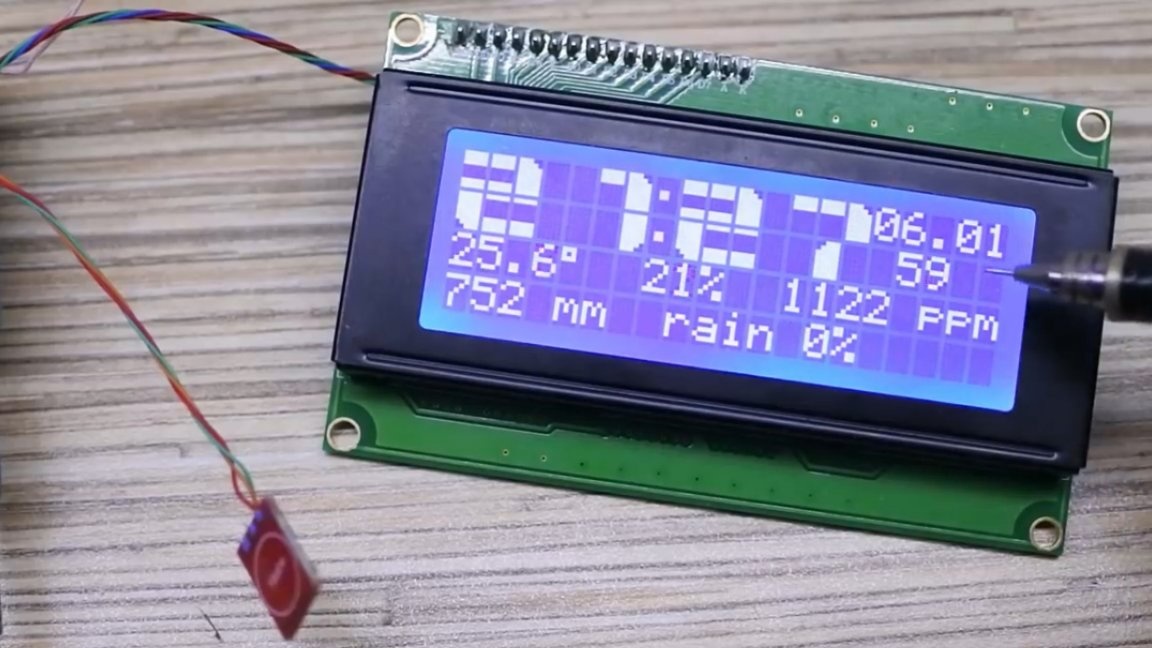
Next, we have temperature, humidity and carbon dioxide.
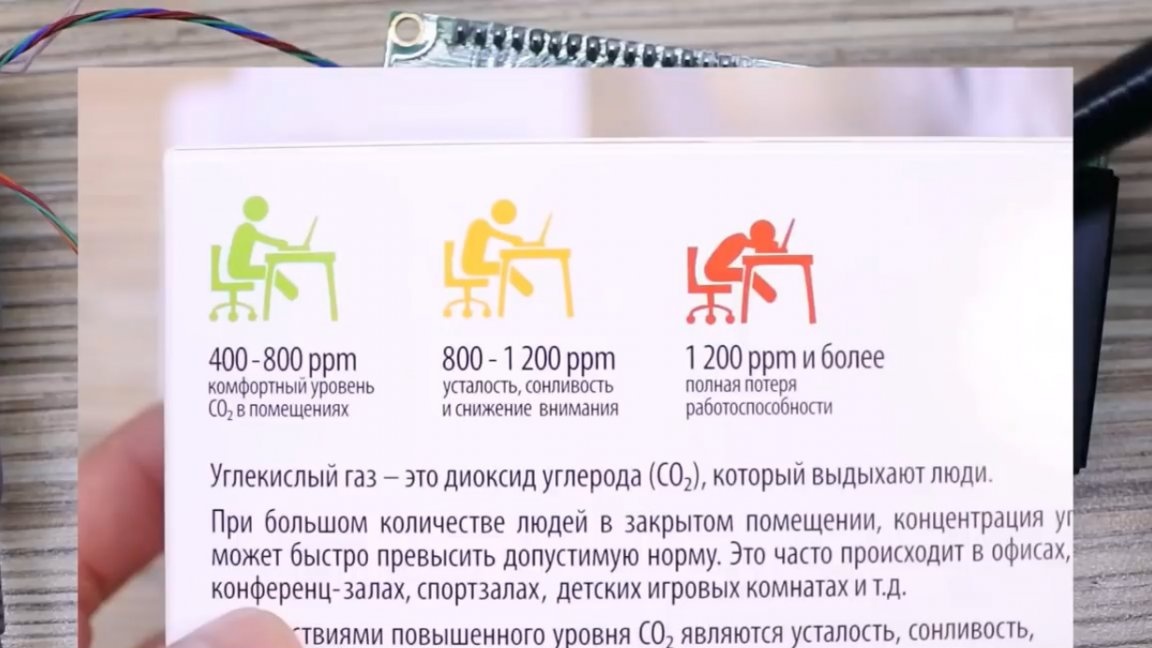
For carbon dioxide, here is a plate:
Atmospheric pressure (in mmHg) and weather predictions based on changes in this same pressure over the past hour.
In general, if the figure reaches one hundredths, then with a very high probability there will be a terrible heavy rain with a thunderstorm in the summer or heavy snowfall with a blizzard in the winter.

If the value is negative, then an improvement in bad weather should be expected. This is such a funny thing.

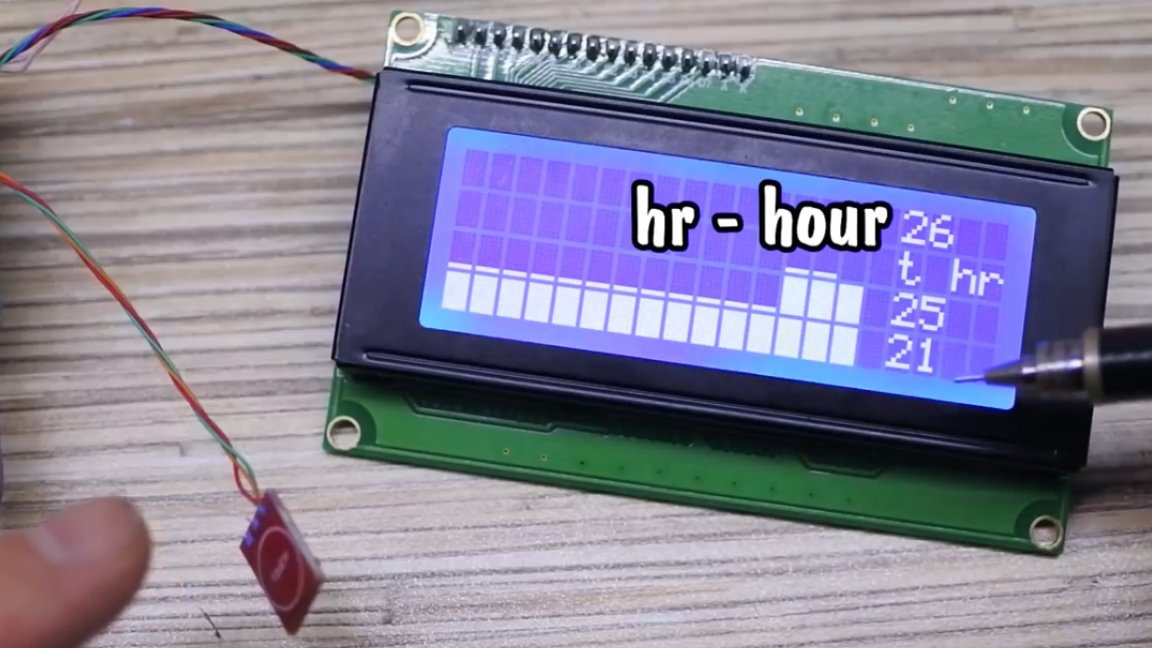
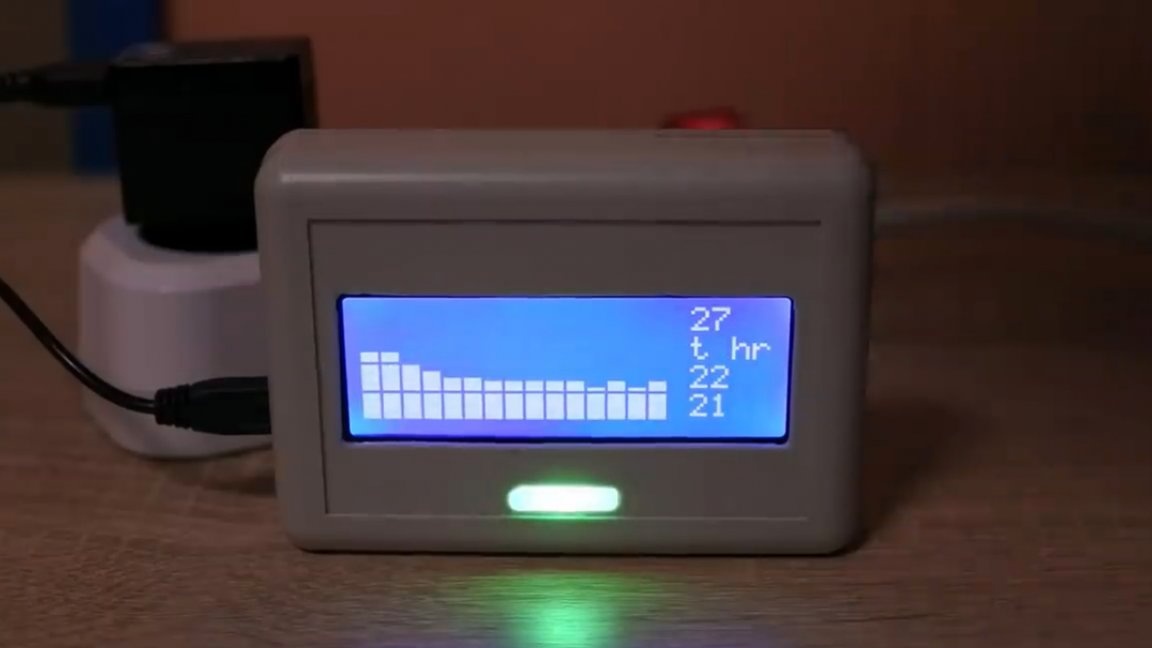
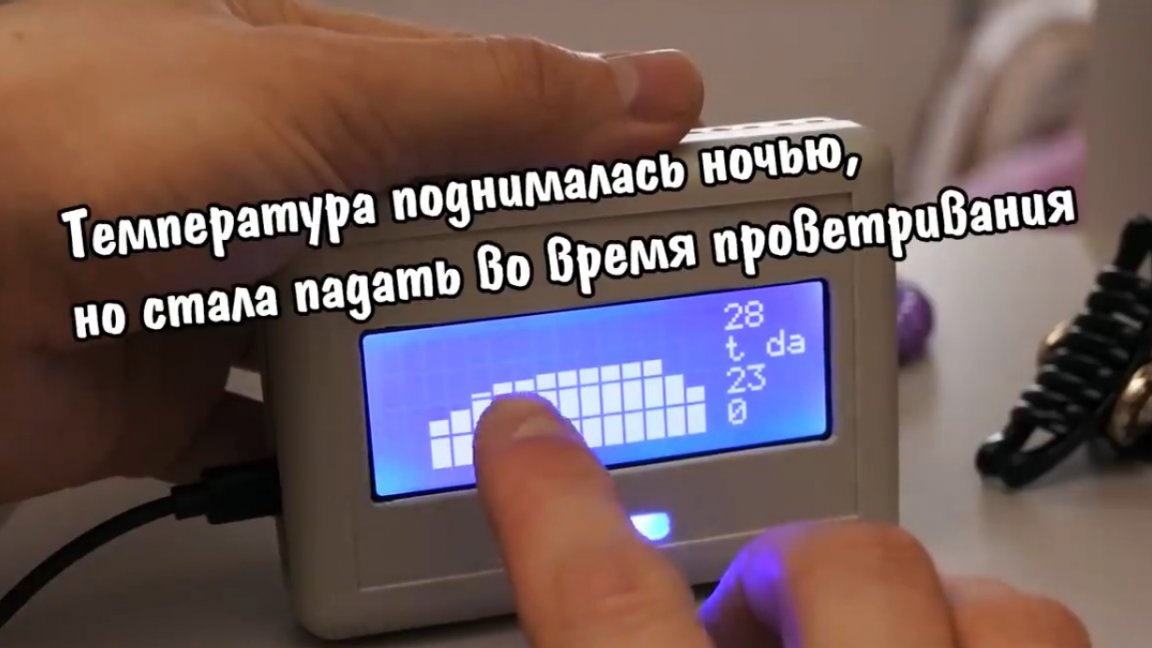
Further graphs. By clicking on the button we scroll through the temperature graph for the last hour. There are 15 columns. The schedule shifts every 4 minutes. Above is the maximum value of the one shown on the chart, below is the minimum of the shown and a little higher is the current one.
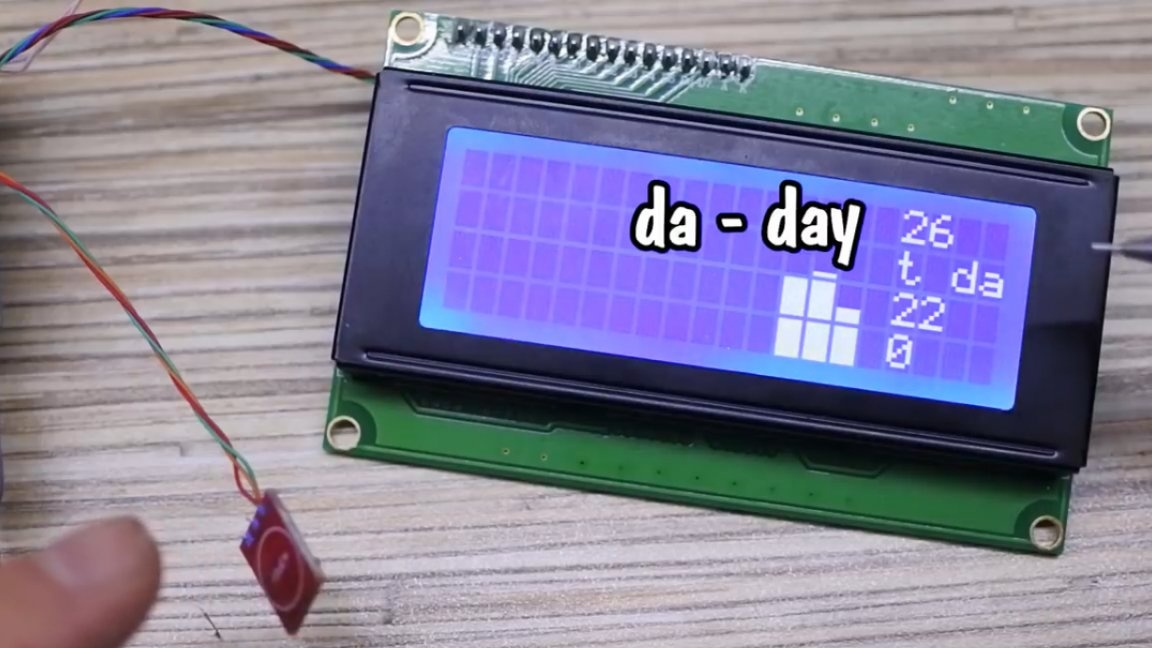
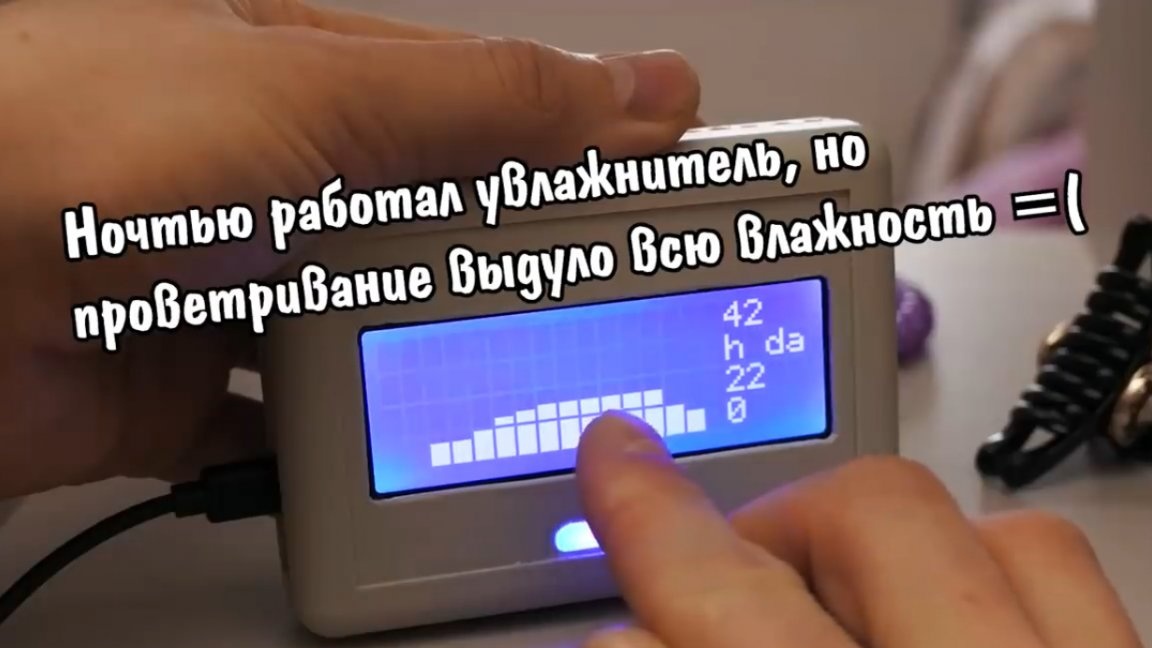
Here the same thing, but in a day.
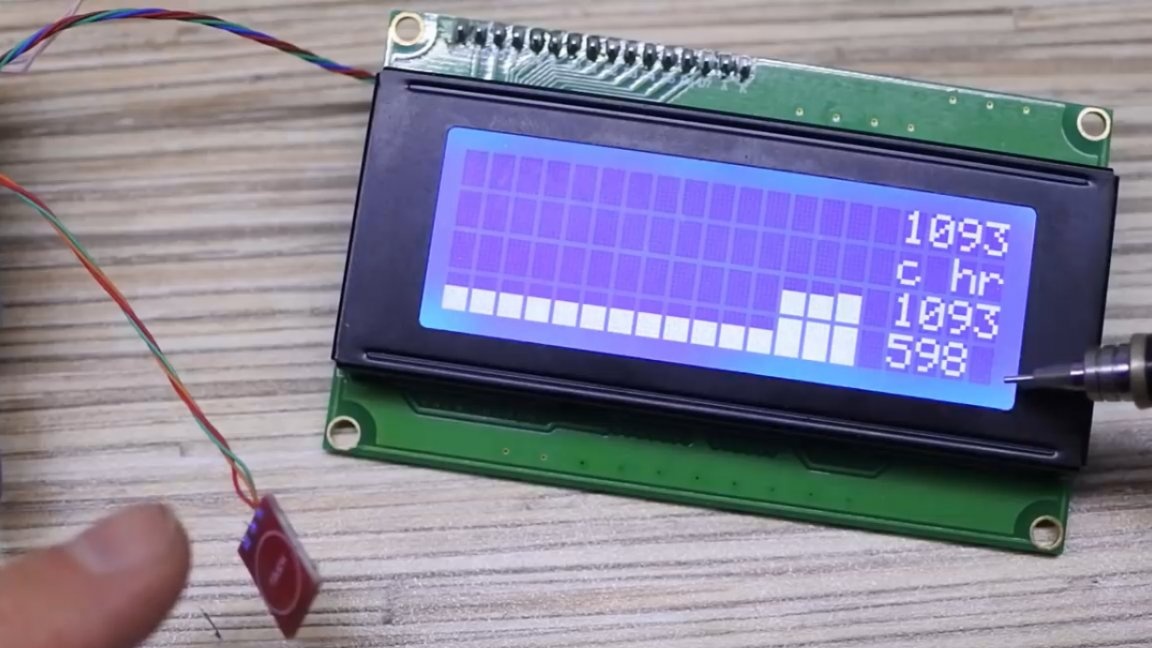
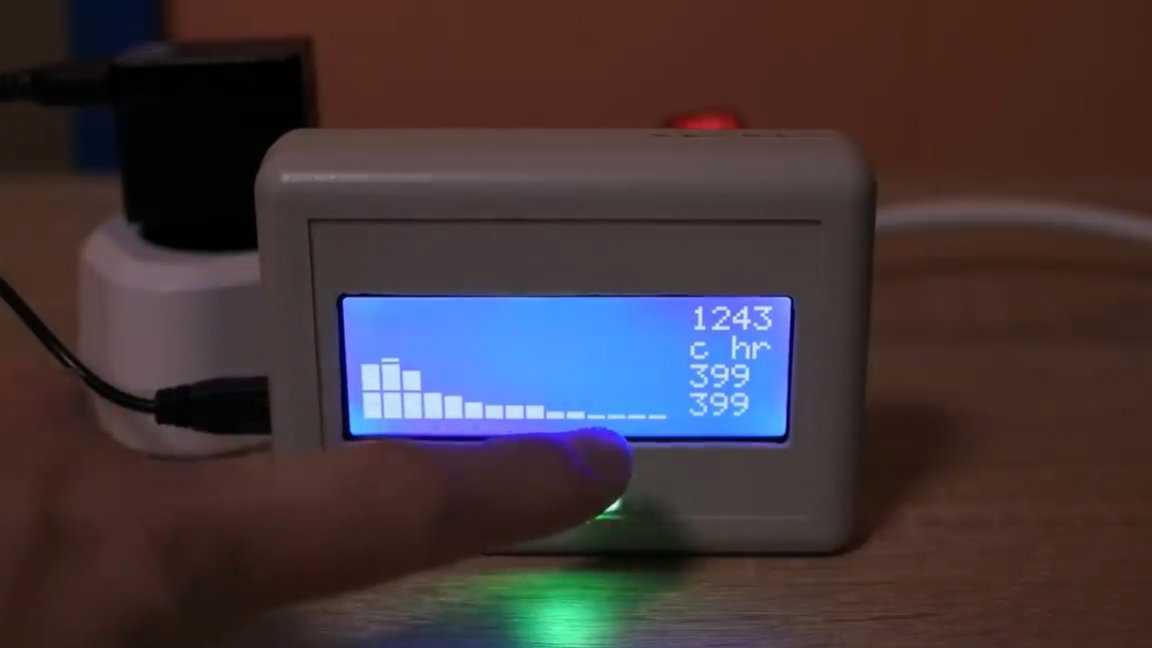
Carbon dioxide.
By the way, from any chart you can go to the main screen by holding your finger on the sensor for about one second.
LED colors. Green is a low concentration of carbon dioxide, blue is elevated, and flashing red is very high, so it is urgent to ventilate.
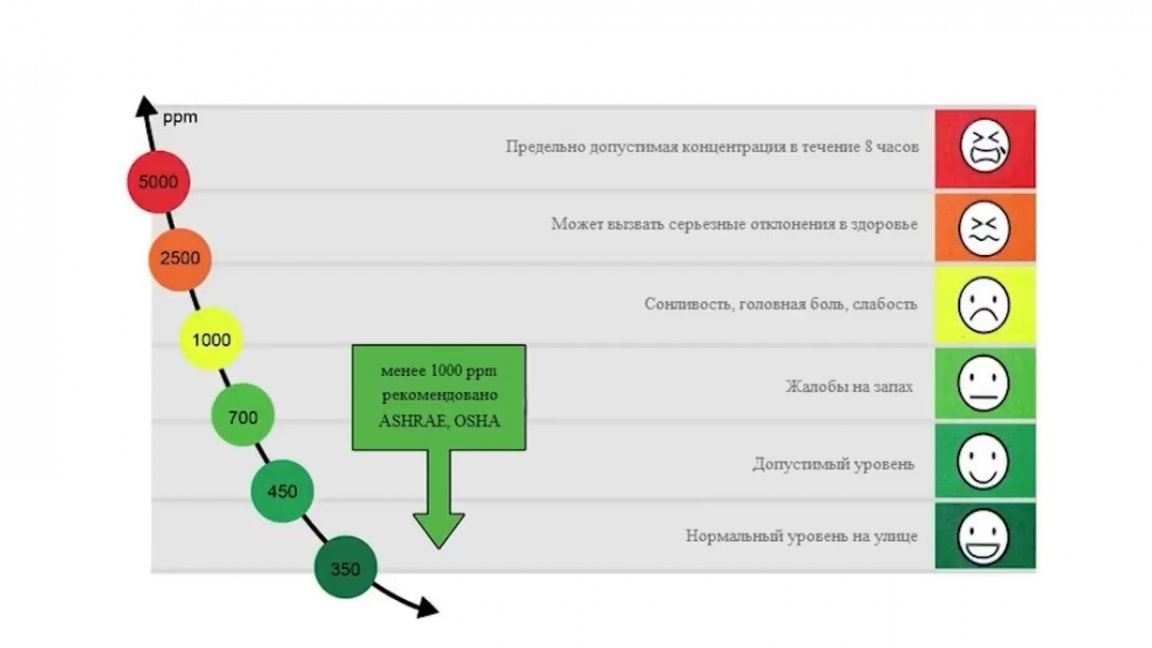
With a high content of carbon dioxide, working capacity decreases, drowsiness and so on, so on, increases.
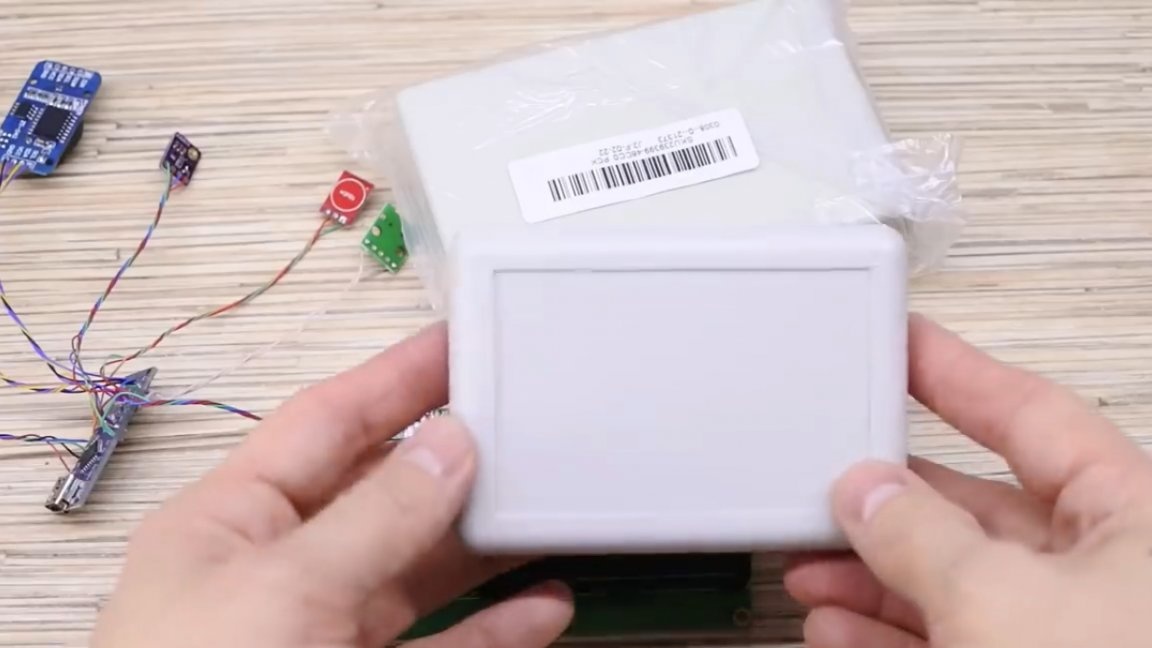
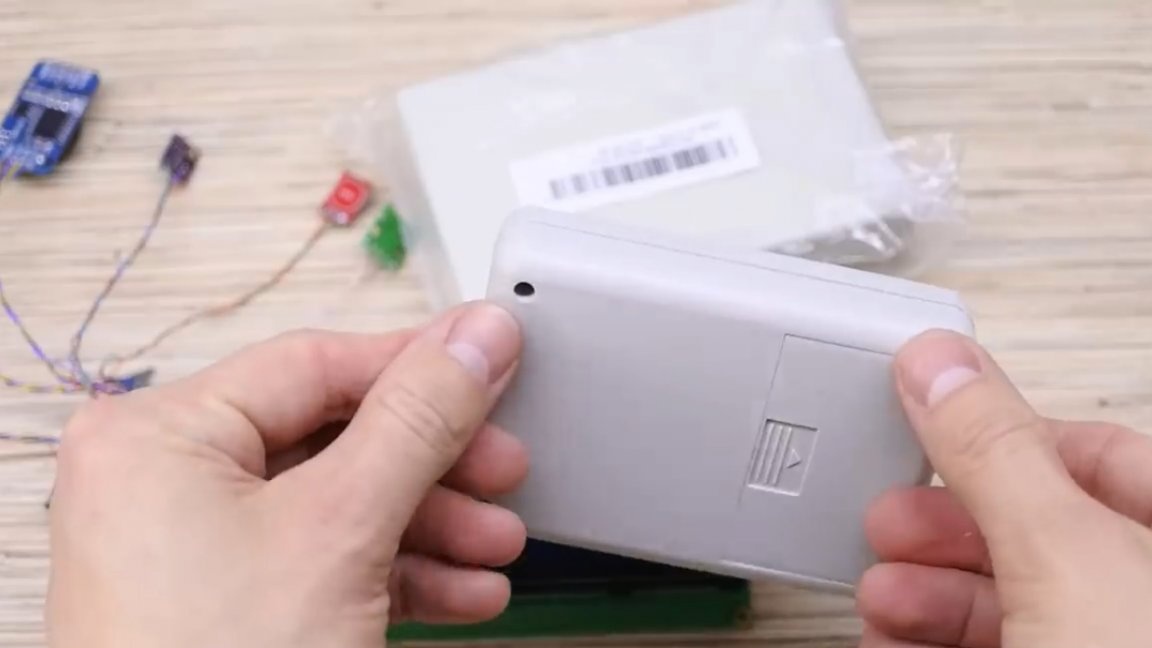
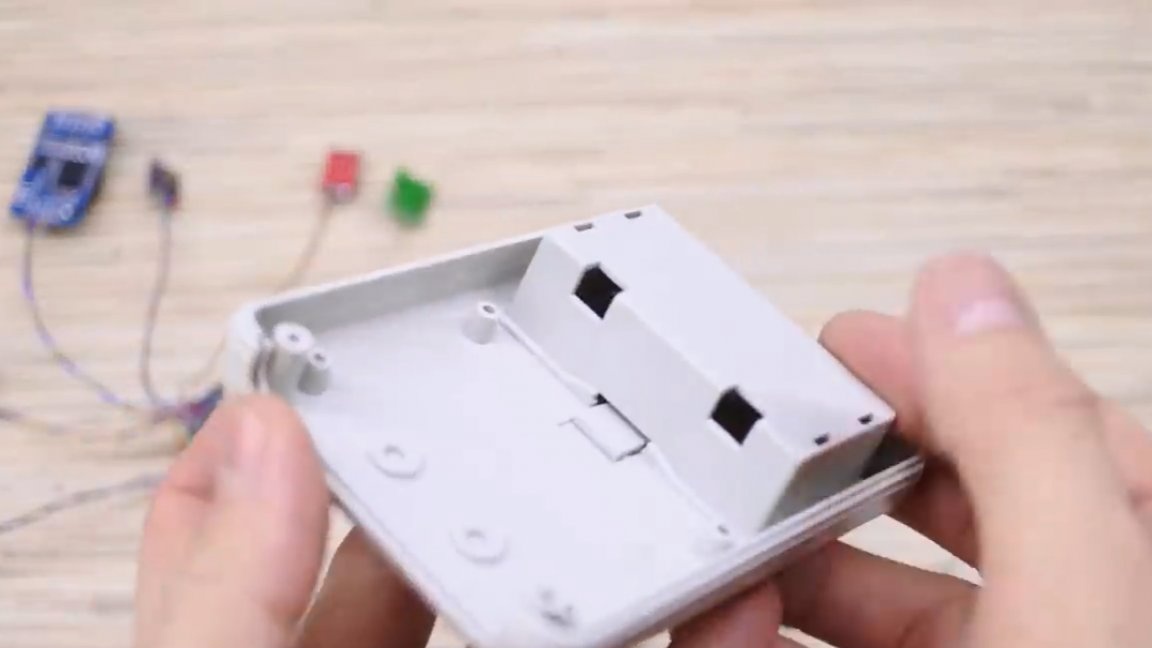
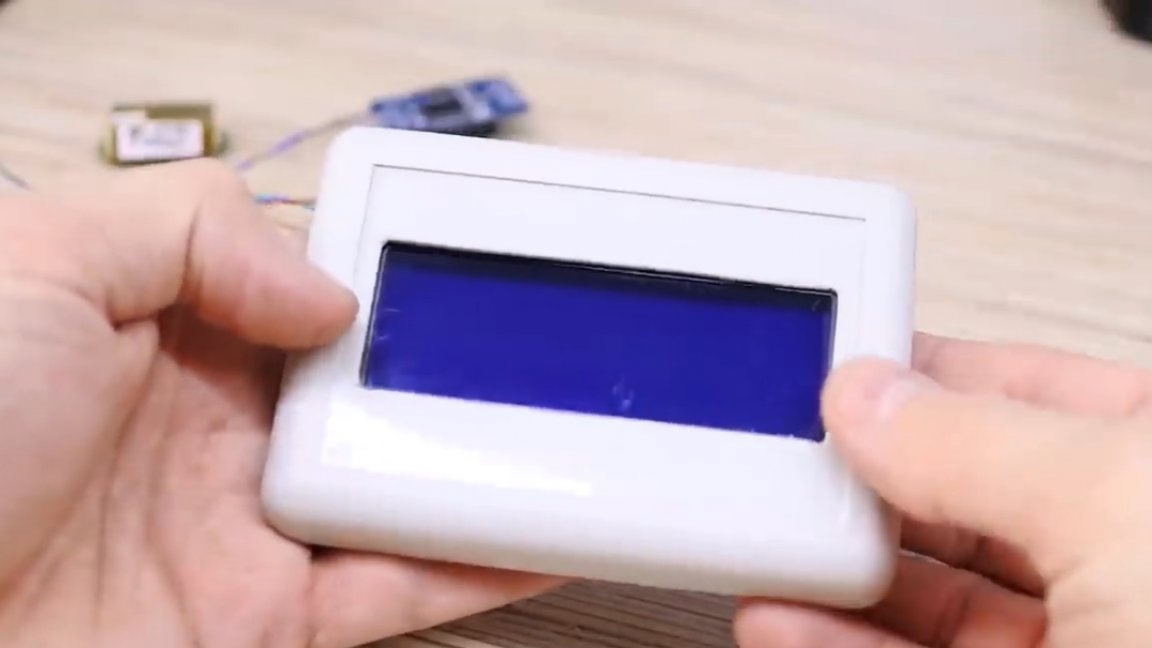
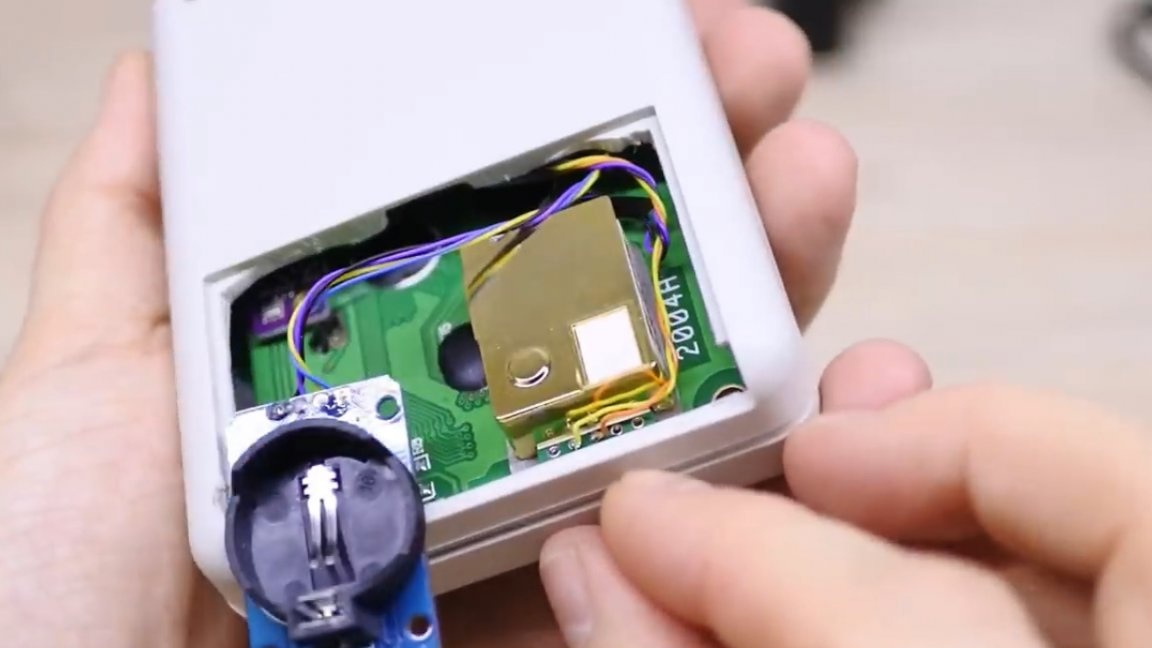
Actually, that’s all that can be said about the firmware. It remains to collect these electronic offal in the case and put on the table. We will use such a case that is ideally suited for this project and in general for 2004 displays, the only thing is that you will have to cut off the extra battery compartment.
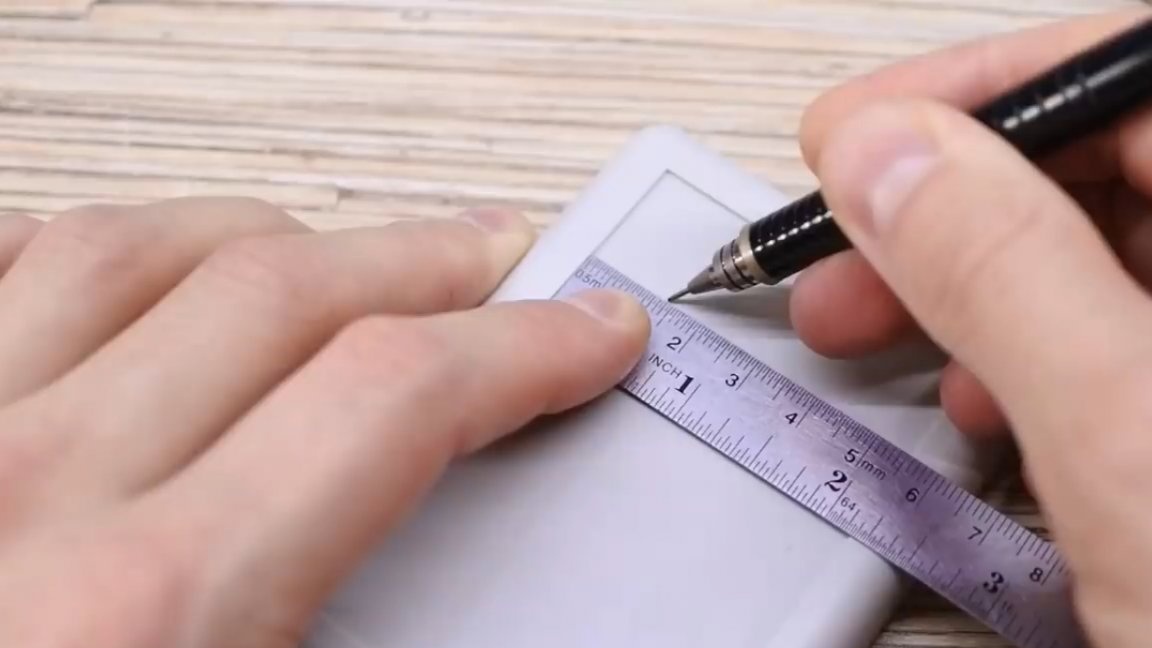
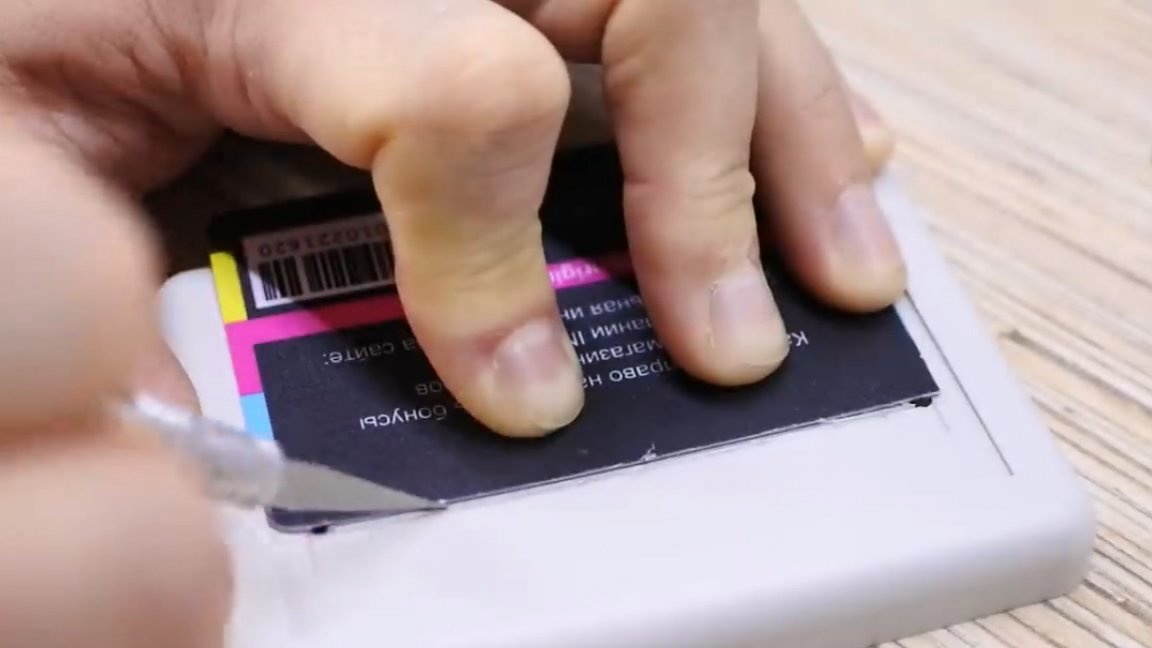
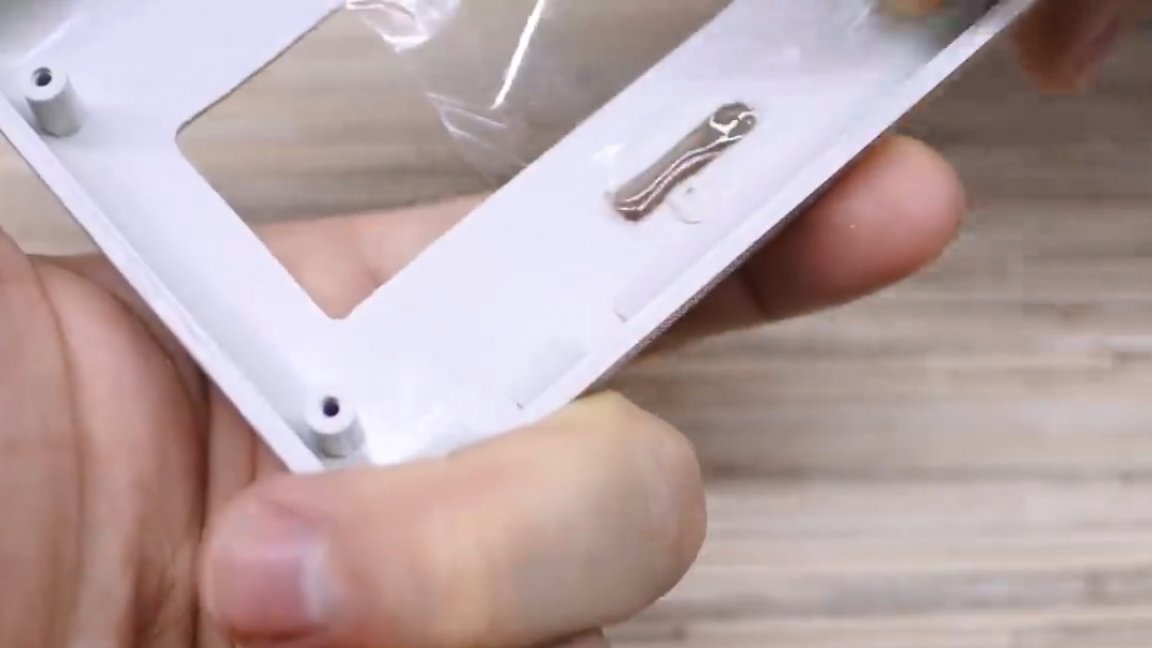
We mark the front part under the display window and cut this window out.
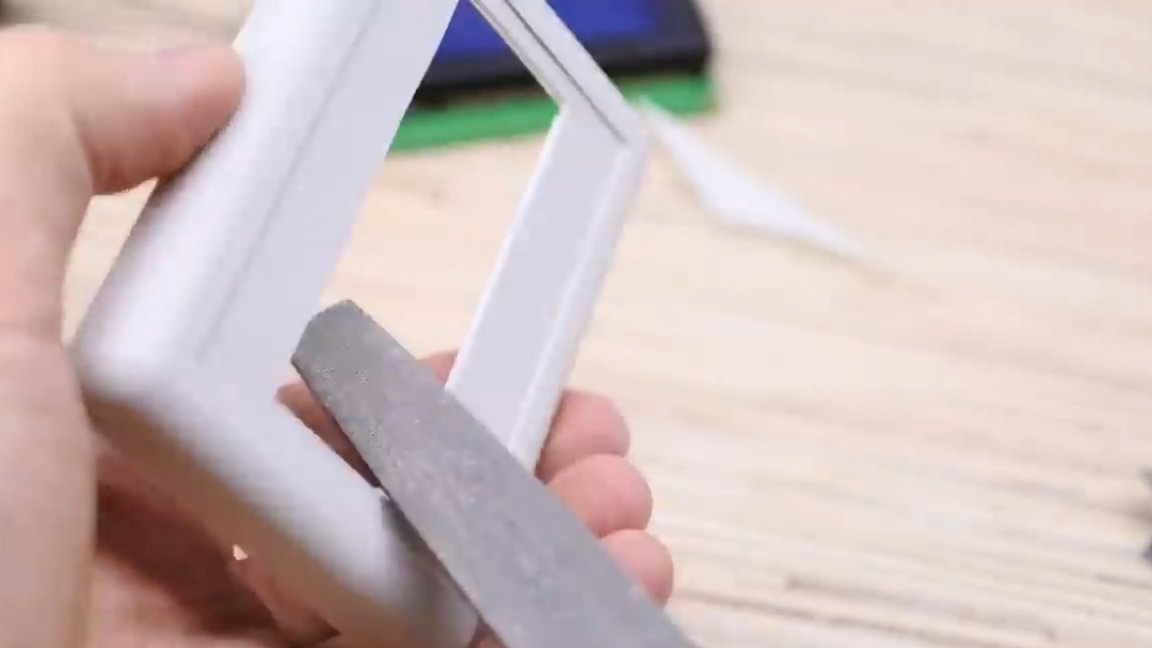
As a result, we get an almost perfect window, which literally needs to be finalized with a file.
Before gluing the modules to each other, it is necessary to determine which of them are heating, so that in the future not to place the temperature sensor next to the warm components. A thermal imager for a smartphone will help us with this.
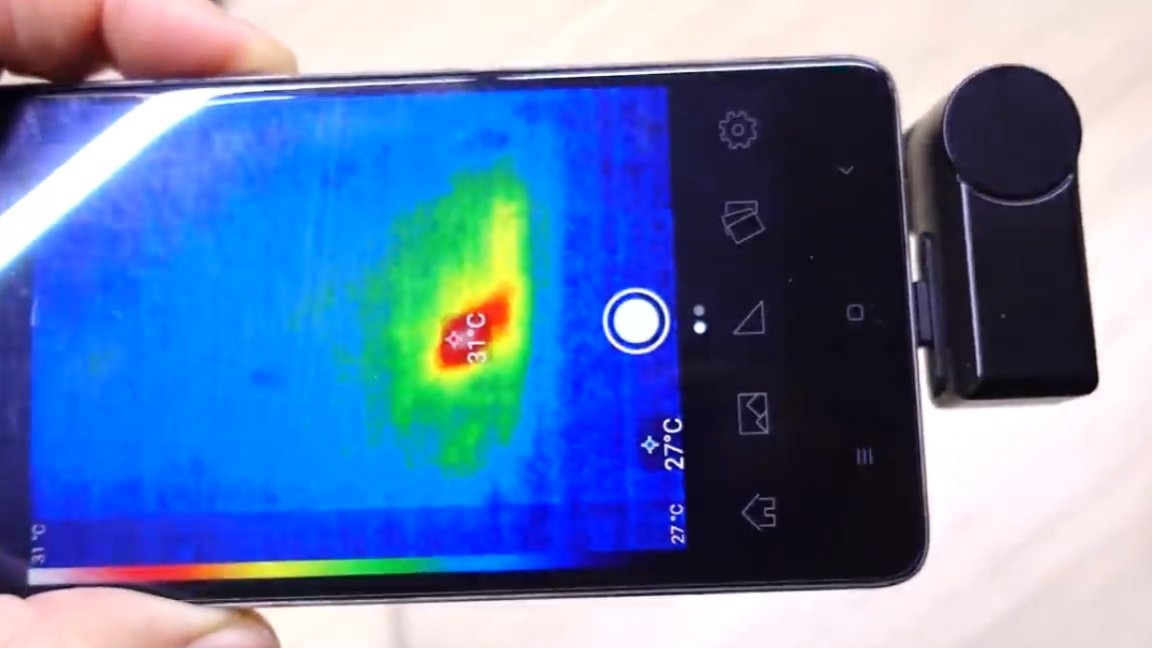
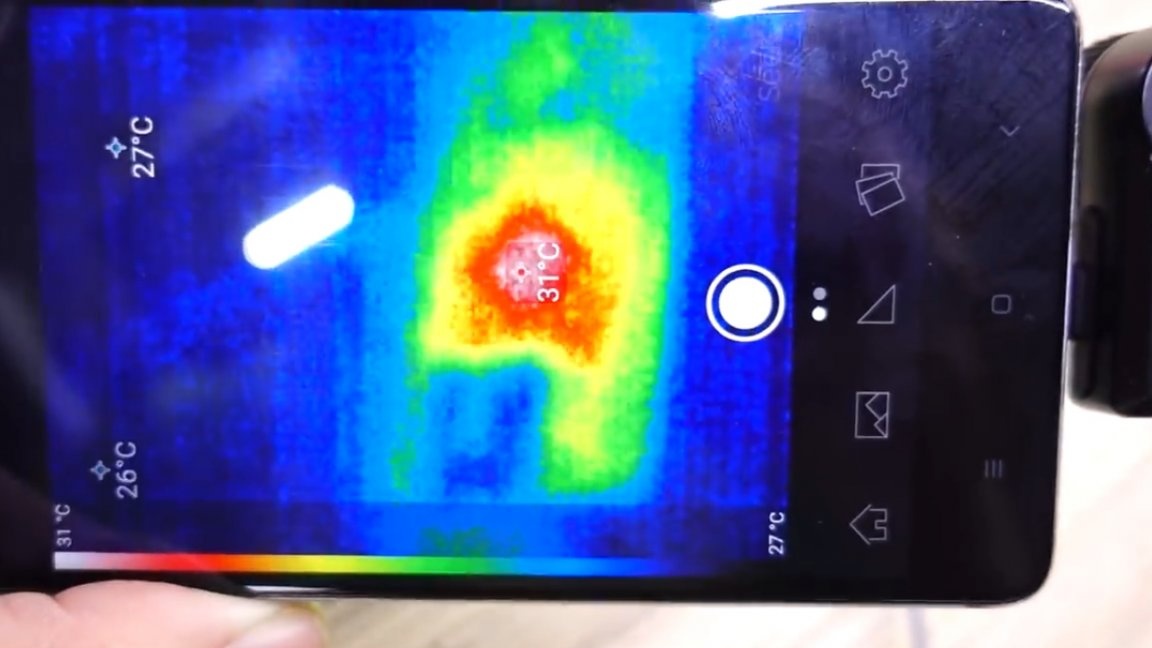
We immediately see how the current limiting resistor of the display backlight heats up, it is definitely impossible to place the sensor here. Of all the other modules, only the carbon dioxide sensor is heated (2 degrees above the ambient temperature). Also, the microcontroller on the board is heated to 30 degrees and the LED is heated very slightly.
Okay, we continue to shred the case and make a narrow window under the LED indicator, which we will fill with hot glue.
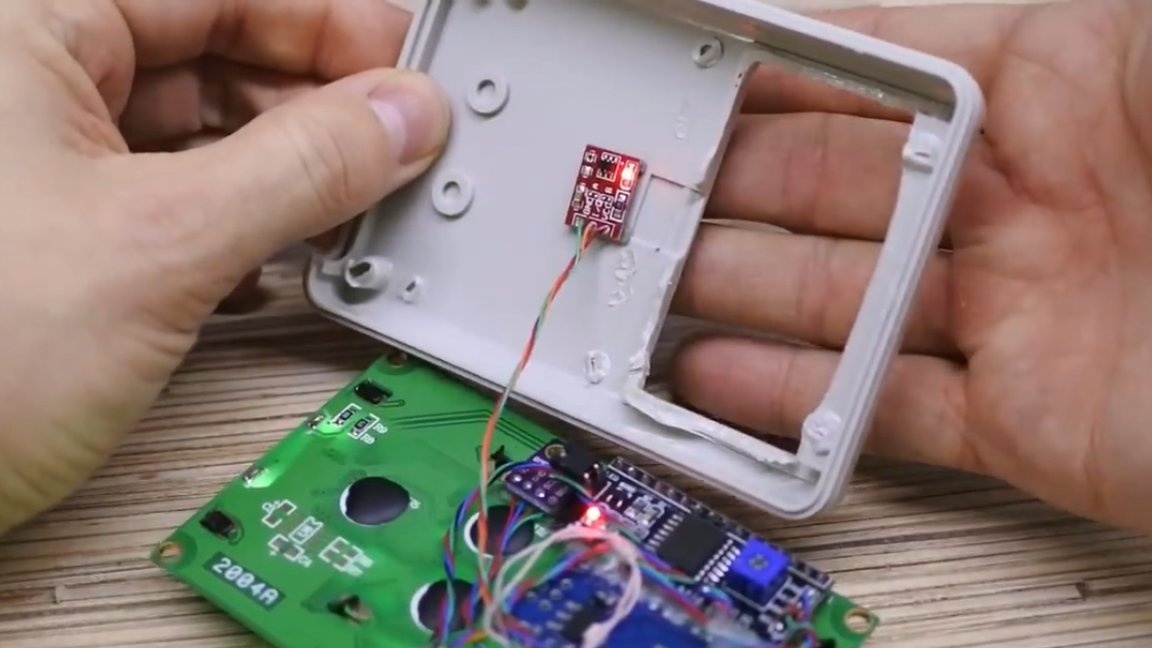
We begin to mount the modules on the display board using double-sided tape and hot glue.
We attach the touch button to the back of the case for 2 narrow pieces of adhesive tape, because you can not press the sensor to the plastic. Using this is very convenient.
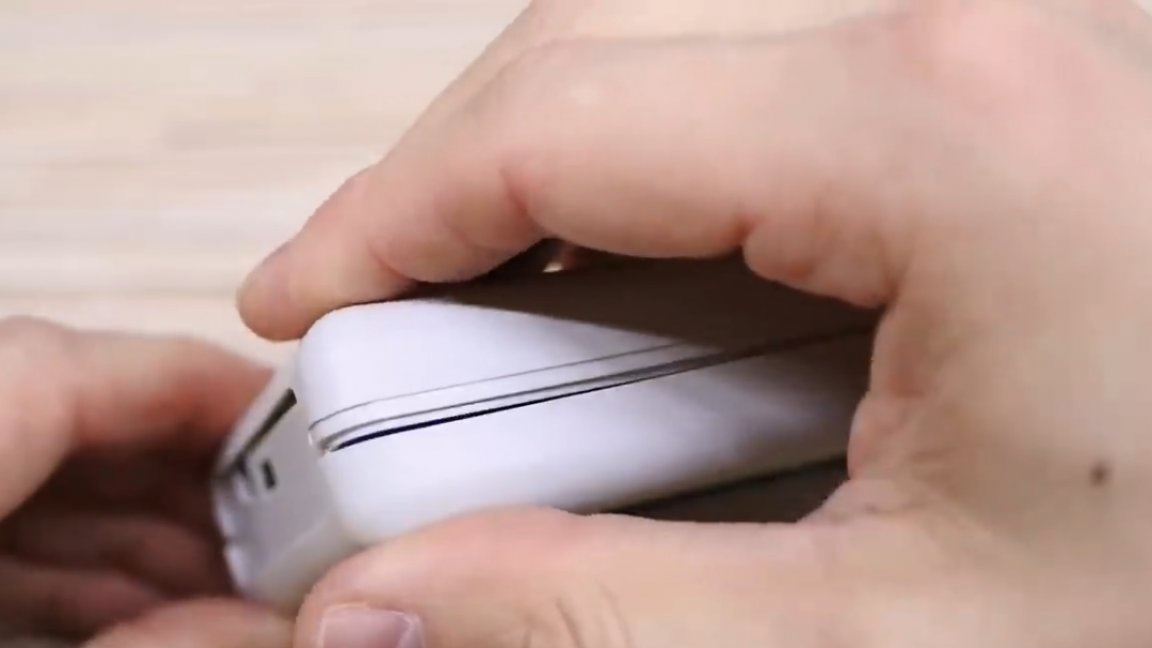
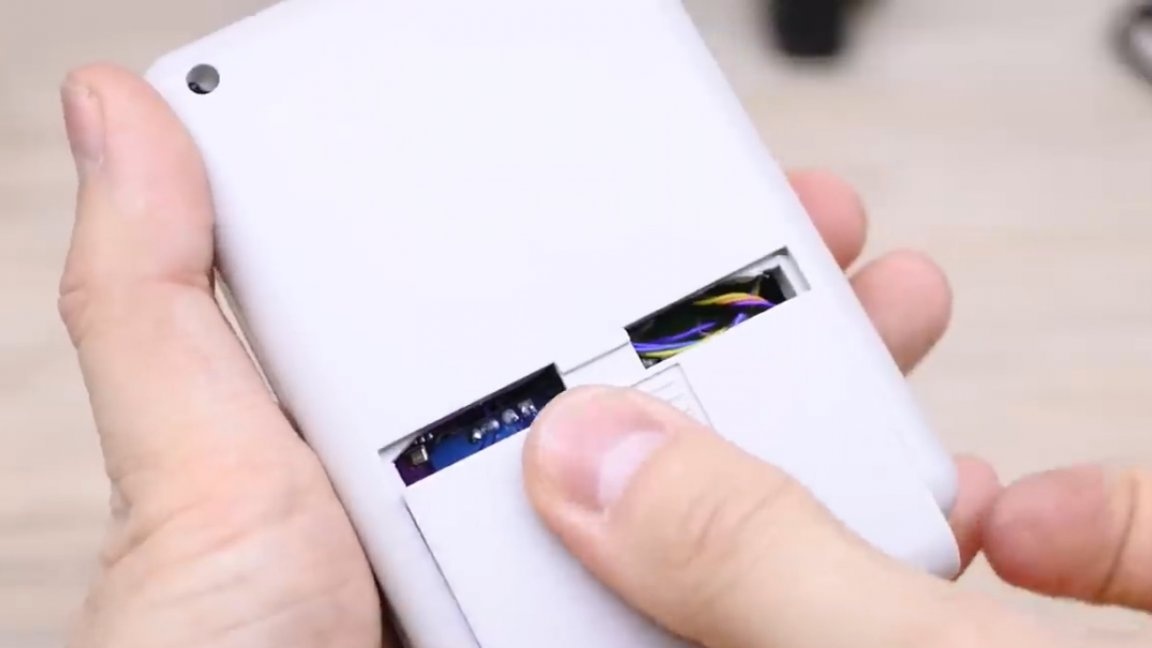
We cut out a couple more windows for the power and firmware ports. Now we need to collect all this. We drip 4 drops of superglue in the corners of the body, this will be enough.
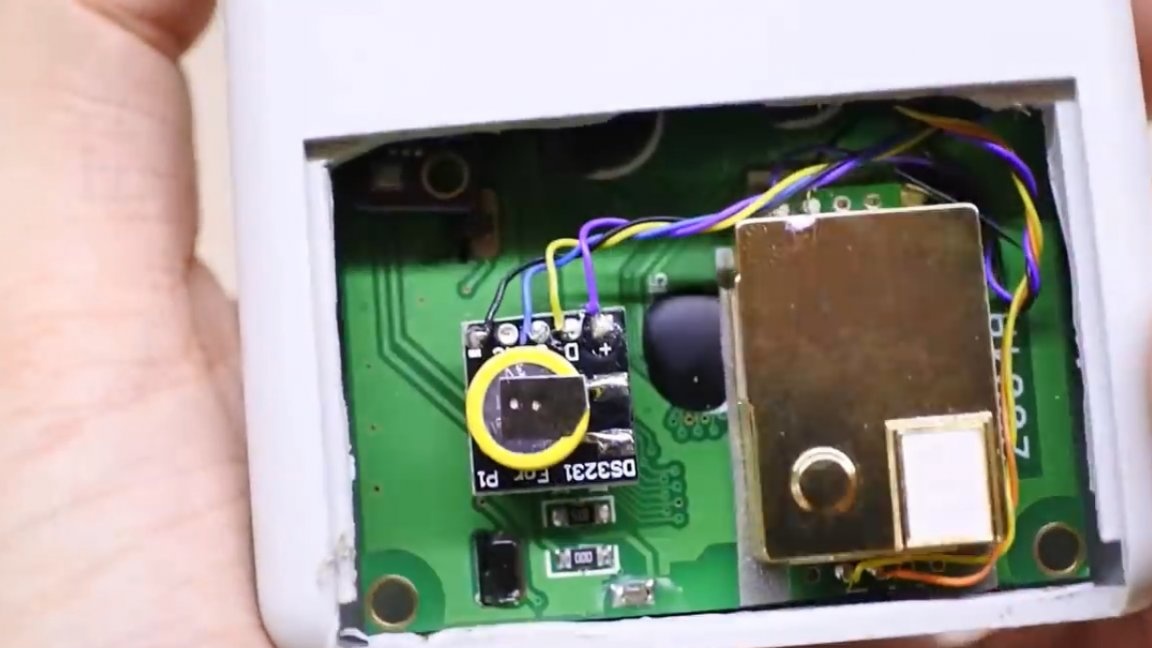
But with the real-time module, we have a problem, it does not fit under the lid.
You can leave it like that, but it will be sad, so the author decided to put a microversion of this module with backup power from the ionistor.
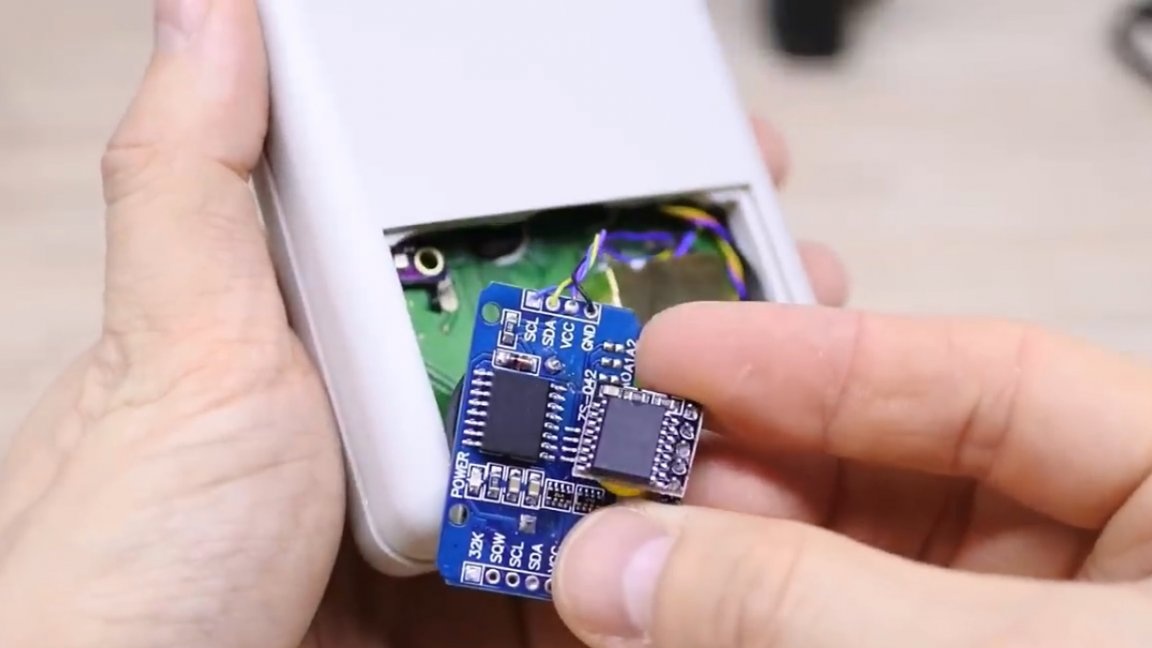
The connection diagram for him is this:
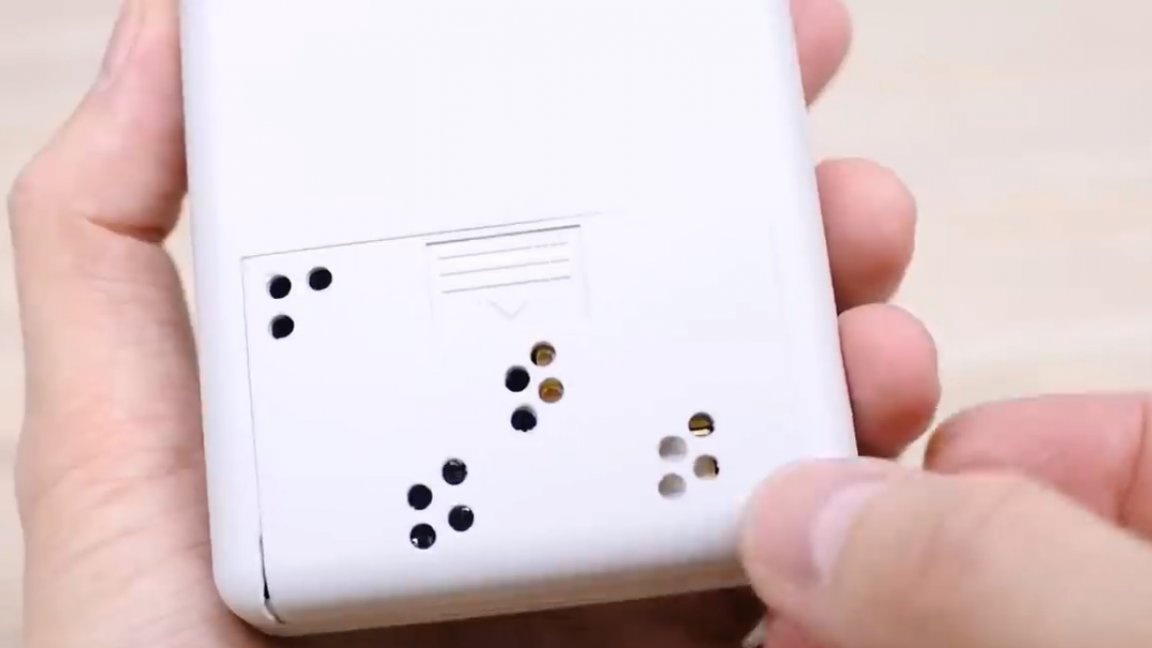
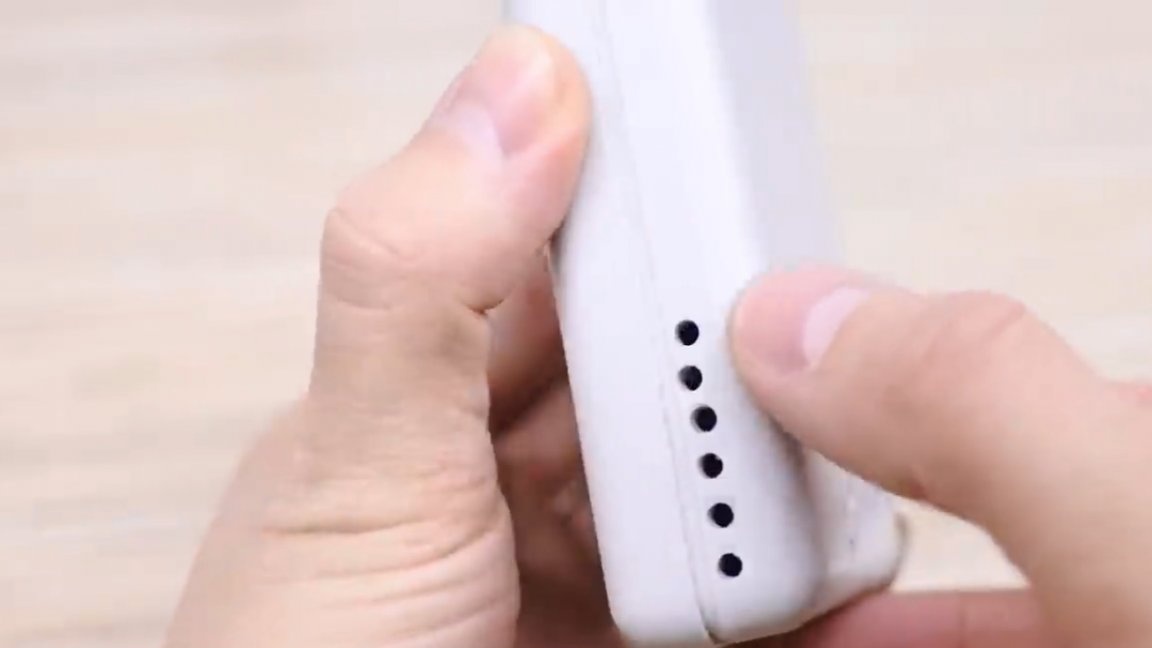
Now everything is perfect. It is also necessary to drill holes for both sensitive locations of the carbon dioxide sensor. For the heating resistors and for the temperature sensor, we also drill holes.
We connect.
We leave the station on the table and after a couple of hours we look at the graphs.
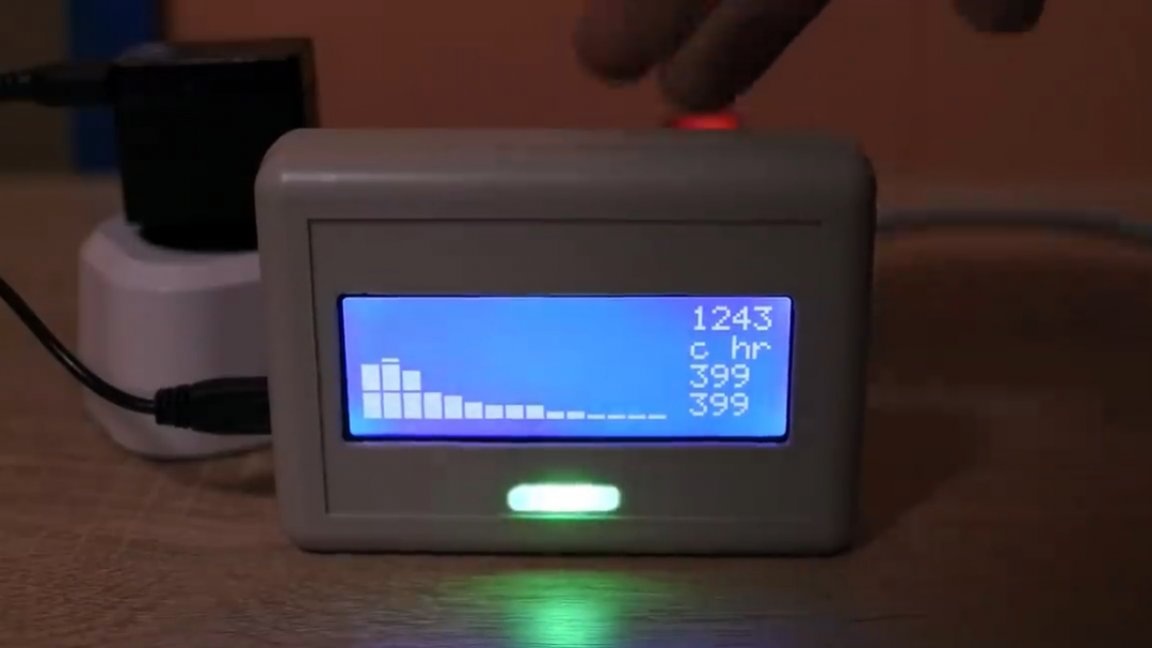
On the graph in an hour we see how the air temperature went down and how carbon dioxide was weathered. We see very clearly the effectiveness of ventilation.
Here we have such a useful device today that will help to monitor the indoor climate even by looking at the measurements once a day, because the graph allows you to literally look into the past, which is very convenient and interesting.
Thank you for attention. See you soon!
Video: